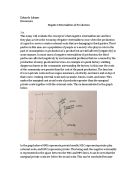
In the graph above MPB represents private benefit, MSC represents private plus external costs, and MPC represents private. This being said, the negative externality is represented in the space between the MSC and MPC lines. It can be seen that the marginal private costs are below the social costs. This can be concluded because due to the production of paint there is pollution being produced causing an extra cost to third parties such as lung problems and respiratory issues. Since the factory is only concerned about private costs it produces at P1Q1 and not at the ideal equilibrium which is at PeQe. At QePe the marginal social costs are equal to the marginal social benefit causing a market failure. The market failure is a cause of over production at a low price. This is also known “misallocation of society’s resources”. This therefore results in a welfare loss which is indicated in the graph above (Q1 to Qe) since the MSC is now greater than the MSB for those specific units.
This as a whole is how negative externalites of production function. In summery, the concept occurs when a factory obtains external costs such as smoke, waste, and noise that all effect third parties negatively. As a result, the producer is not producing a socially efficient output (QePe). It then results in market failure (over production at a low price) and welfare loss; while profit-seeking companies continue to only take account for their private costs. The producer is then making a profit while the third parties lose money. It is at this stage the government has to step in.
b. One of the policies that a government could add to avoid market failures is to enforce taxes. This will minimize the welfare loss as indicated on the graph above. The government is able to minimize welfare loss with taxes by taking money and making changes for eliminating the negative externalities. The government is then able to increase the producer’s private costs which causes the MPC to move upwards as indicated above (MPC MPC + Tax). This is able to move the MPC to a point where the producer is producing closer to the equilibrium. If the government is able to make the tax equivalent to the external costs then they have “internalized the externality”. However, if the government is not able to equal the external costs then they are still able to minimize welfare costs as demonstrated on the graph.
Disadvantages to government taxing is that it is not perfect and money goes to the government. Further, it is difficult calculate how much pollution is being created by a certain firm and then to put a value on the amount of pollution. Finally, some believe that there is no evidence that taxes can reduce pollution.
Another, more drastic approach would be to have the government ban all the major polluting factories. If not they could pass a law forcing each factory to only be able to produce a certain amount of pollution during a certain time period. This makes factories use private costs to improve and make their factories more environmentally friendly.
The negative side to such a solution is that a ban/restriction would most likely lead to a rise in unemployment rates. It could also produce non-consumption. Finally, the cost of setting such standards and policies could costs more than the costs of pollution.
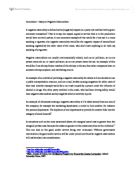
Conclusively, the government could issue tradable emission permits. This is a market-based solution to negative externalities of production. These permits issued by the government allow companies to produce pollution to a certain level (quota). Once a company is issues one, they have the right to buy, sell, and trade the permits on the market (cap and trade system). This then promotes initiative for companies to produce less pollution. If they produce over the set amount they must buy a tradable emission permit from another firm, raising its costs. Visa versa if they produce less pollution then amount issued the firm is allowed to sell their permit.
This becomes an issue that does not really do much. The pollution remains and corruption among companies arises. Further, it is difficult to measure a factories pollution output.
Below are examples of how firms can use these permits efficiently (right) and inefficiently (left). Notice the difference in the welfare loss (shaded in area).
This is the basic concept of how negative externalities of production arise and some of the solutions available to minimize them.