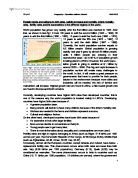
Figure 2: Physical Map of Woluwe Park
As such, my research question is: which factor has the most effect on infiltration rates in a green space in Brussels, Belgium? The study hopes to show that even with a limited amount of apparatus and limitations on testing other types of inputs and outputs in the hydrological cycle, different parts of Woluwe Park fit the hydrological generalisations of infiltration rates. Additionally, it hopes to formulate a conclusion concerning the importance of infiltration rates and the interaction between the Woluwe commune and its park.
II. Methodology
i. Apparatus
Materials used to test the infiltration rates included a 31.5 by 12.5 cm cylindrical metallic tube, a mallet, a 30-centimetre ruler, 1.5 litre bottles of water and a timer. Upon removal or smoothening of the surface (pulling out grass), the cylindrical tube was hammered into the ground with the mallet. The water (all 1.5 litres) was then poured into the tube, in which the timer started after all the water was poured. The ruler was then placed in the tube to measure the starting water level. The water level was recorded, in centimetres, every minute for ten minutes.
All data was recorded on simple recording sheets by a second person, who would also be the timer. A cylindrical tube was chosen to make sure the area of infiltration was compact and sealed. Although realistically the water level would never rise so high during even the most intense storms, a large quantity of water ensured a sufficient timing period. A 30 cm ruler was used, as it was similar to the height of the tube, making it much easier to see the figures on the ruler for the observer. Finally, the methods used to test the type soil were purely observational and qualitative methods used by a self-study guide (see Appendix B).
ii. Geographical Relevance
The investigation was carried out at six different sites (Figure 2). As it would have been time consuming to experiment more, the experiment was only carried once per day. Days of experimentation were July 7th, 13th, and 19th; six-day intervals. Six days were chosen to allow more time for the weather to have some sort of significant affect on the park itself, so with the help of secondary weather forecast data it could be possible to account for some factors affecting infiltration rates (e.g. if it rained throughout the week). The experiments were carried out between similar time frames from 11.00 to 14.48.
The six sites were chosen on the basis of variations in topography, vegetation, soil texture, and adjacent possible external factors (e.g. a pond). Site one was at the top of the slope next to the road (Fig 2) and near vegetation. It was an area most exposed to sun and with nearby vegetation containing an abundance of roots that could have affected infiltration rates. Site two was near one of the ponds. Because this is essentially the bottom of the run-off slope, and is near a pond, much of the water will settle next to the pond, meaning that the soil should have been saturated – based on hydrological generalisation, the runoff inputs are abundant near this pond. Site three was on the other end of the pond, where there was a lot of exposure to the sun, a common spot for all animals of the park (whether it was geese, ducks, or domestic dogs) to excrete their faeces, which may have affected the capillary action, and was on a relatively steep incline. Site four was a compact, consolidated dirt path under an abundance of overlying vegetation, making it a site susceptible to relatively low infiltration rates because of the low porosity and high interception storage. Site five was under much overlying vegetation and natural dirt ground. It was not only exposed to the sun, but heavily vegetated, so it was expected to be an area of high infiltration. The final area, site six, was next to the football and tennis sports club centre, between two road paths. It was chosen for the purpose of examining how human modifications, such as roads, could have affected the infiltration rates. The sites were chosen by quota sampling, meaning that the appropriate ecological variations were not at systematic distances (see Figure 2).
III. Data Presentation and Analysis
After recordings the results (Appendix A), it was decided that any graphs to be shown should include the change in the amount of water infiltrated through the ground rather than the level of water, as it is less likely to be affected by the uncertainty of how far in the ground the cylindrical tube was placed. Also, when water is placed into the tube through a plastic bottle, it ‘lunges’ out – the impact of the water as it fell into the tube could have forced the lower levels of water into the ground, possibly lowering the water level significantly from the start. According to physical laws, the rate of change of the amount of water infiltrated through the ground should decrease exponentially, as the less volume of water there is the lower the pressure. Figure 4 is a graph proving this trend.
Figure 4, Day 1 Site 5
Site 5, as stated previously, was chosen because of its abundance of trees and ground vegetation, as well as its exposure to sunlight.
By the seventh minute in Figure 4, the zero change in the amount of water infiltrated indicates that the water has completely absorbed into the ground. There is a very high change from the first minute, plunging down from 4 cm to roughly 1.75 cm before it starts to consistently flow downwards and upwards in a sinusoidal manner until it reaches 1.5 centimetres, and finally, zero. This graph fits both a geographic and physical generalisation: infiltration rates will increase in areas under much vegetation, as well as if the temperature is relatively high and the soil is porous. Additionally, the trend is negatively exponential according to pressure laws. This accounts for the accuracy of this experiment and this graph. According to Weather Underground, around 12:20 (this particular experiment was started at 12:15), the microclimate temperature of Brussels was 18 degrees Celsius, which is warm, but not significant enough to speed up the infiltration rate. The composition of the soil was sandy loam, which is relatively porous, meaning infiltration should increase. Because the temperature is not necessarily high by means of increasing evaporation rates significantly, it is safe to assume that the main factors of this trend were the porosity and interception storage of overlaying vegetation.
Figure 6, however, shows a graph of Day 3’s experiment at site 5 instead: there appears to be no trend in relation to the physical law of pressure.
Figure 6: Day 3 Site 5
This set of data appears to be very different to both Day 1 and 2’s trends. As Figure 4 shows, there is a negative exponential rate of change that was also accounted for by typical infiltration rate factors (Day 2 had an almost exact similar trend). Here, the rate of change never exceeds 0.9 cm, and it erratically sways up and down along the graph, ranging from 0.5, to 0, shooting back up to 0.8 cm, finally converging to 0.1 cm. Day 3 had identical conditions to Day 1 and 2. According to qualitative observations, the weather was dry and sunny at 14:20. Additionally, according to Weather Underground, the temperature at this particular time was 23 degrees Celsius, warmer than average and thus should increase the infiltration rate. This set of data can be justified to be an anomaly. Generally, these warmer conditions should have increased the rate of change because of the increase in evaporation. However, unlike the other 2 days, no geographic generalisations are applicable. Reasons as to why the results may have been relatively inaccurate are, possibly, because the area of experimentation was a few metres away from the previous two studies. It is possible that there may have been less interceptive vegetation and more shade. This assumes that the lack of vegetation and slight increase in amount of shade were significant enough to make the infiltration rate completely static, which is highly unlikely. Figure 8 and 9 are the graphs of changes in the amount of water infiltrated in Site 3 on Days 1 and 2.
Figure 8: Day 1 Site 3
The soil was wet and loamy on Day 1, meaning the composition itself had a high porosity, however, since it was wet it indicated saturation. As seen by the trend in Figure 8, with the rate of change of the amount of water infiltrated through the soil ranging from as little as 0.25 twice, and then plunging down to zero, this wet and saturated soil most likely accounts for the almost non-existent trend. At 11:42, when the experiment for Day 1 Site 3 was conducted, the temperature was 18 degrees Celsius. Qualitative observation shows that at that particular time of day, it was in fact sunny. However, what is far more interesting to take into account is the amount of rainfall that had affected Woluwe Park the preceding week, most notably on July 4th and 5th, where precipitation was 0.31 and 0.20 inches respectively. This high amount of precipitation indeed accounts for Figure 8’s trend, because of the high amount of saturation.
Figure 9: Day 2, Site 3
Figure 9, on the other hand, had higher results in the rate of change. However, it was very erratic. Like Figure 6, this graph does not support the geographical hypothesis that when soil is saturated, generally no water should be infiltrating through the ground. Instead of a more static result like Figure 8, it appears that even on a day (at 13:20) with 21 degrees Celsius (i.e. not a significant effect on evaporation rate), there is still some sort of change occurring, ranging from a maximum of 1.175 centimetres all the way down to 0.315, approximately. A reason for Figure 9’s strange result in comparison to Figure 8 is because of the positioning of the tube. The experiment for Figure 9 included a sloped cylinder when it was hammered into the ground. It is possible that water may have escaped through the bottom when it was being poured in. Alternatively, it could be that because the tube was on a much steeper slope in comparison to Day 1’s trial, the steepness of the slope, physically, increased the velocity of the infiltration rate.
On all three days, sites 4 and 6 showed marginal rates of infiltration. Site 4 is a compact path, located under heavy vegetation, connected to a stone path. On all 3 days, the composition of the path was dry soil, a very porous material. As it is a popular path for joggers and walkers, it is evident that these people are to account for a consolidated path. With consolidation comes far less porous spaces to allow water to infiltrate through soil. Why this particular site is of interest is that not only is it unaffected by temperature, it is also covered by many trees. Also, the soil was always dry, meaning that there must have been very low saturation. Based on these observations it is safe to assume that consolidation has a greater effect on infiltration rates than saturation and temperature. The following page shows graphs (Figures 10, 11) of the trends of changing infiltration rates on Days 1 and 2, respectively. Day 3 was not included as no changes, at all, were present.
Figure 10: Day 1, Site 4
Figure 11: Day 2, Site 4
Both figures show marginal changes in the rate of change of infiltration, with the maximum value being 0.25 centimetres as it fluctuates between zero and 0.25 cm. Site 6 was relatively similar to Site 4.
Figure 14: Day 1, Site 6
Above, in figure 14, is collected data of a trend that is relatively similar to Figure 11. The values do not exceed 0.25 cm, as it fluctuates between 0.25 and 0 cm. Plotted results for Day 2 and 3 at site 6 are not necessarily identical to this trend, however, they similarly do not exceed 0.25 cm for the change in the amount of water infiltrated. The soil composition for site 6, in this case, was wet loam. This means that there must have been some saturation in the soil (as stated above, the precipitation figures for the week before Day 1 was relatively high). Additionally, loamy soil is not as porous. It is possible that the soil in this area was compact as it is adjacent to a sports centre meaning inhabitants may go there often. This means the soil is quite compact. However, it was observed that it is usually very sunny in this area. Like site 1, site 6 was exposed to a lot of sun. At 12:30, when the experiment was started, the temperature was approaching the maximum temperature for July 7th. Figure 15 shows the trends in Day 1’s temperature changes, showing the maximum temperature peak of the day.
Peak temperature
Figure 15: Temperature Variations for July 7th. Source; Weather Underground
This ‘peak’ (~21 degrees) is important because at this site, where it is elevated more than other sites and is exposed to much sun, there should have been some sort of evaporative action occurring. Lastly, around this time, clouds were scattered, allowing more sunlight to pass through. This site is also surrounded by stone roads. As the roads tend to have impermeable surfaces, the road on the upper side of this area may act as a smaller version of a run-off slope – as roads are impermeable -- essentially meaning that a lot of rain is transported there, hence, the saturation.
To further prove that surrounding lateral variations in permeability have a significant effect on saturation, notice that in Figures 16 and 17 below, the trend of the change of infiltration rates in Site 1 for Days 1 and 3 (Day 2 had static figures). It is also a heavily exposed area to sun, and is elevated at a similar elevation to Site 6.
Figure 16: Day 1, Site 1
Figure 17: Day 3, Site 1
First, to clarify, although Site 1 is adjacent to the main road that surrounds the vicinity of the outside of the park, the road is relatively flat and there is a lateral variation of vegetation which may account for absorbing any rain that happens to run-off the road into the park (Fig 18). Figures 16 and 17 both follow the geographical and physical generalisations as stated above for Site 5. Based on the results of Site 1 and 6, it is safe to assume that in this case, saturation has a significant effect on the rate of change of the amount of water infiltrated, however, elevation and exposure to the sun also have a significant effect on the definition of a graphed curve of the rate of change in the amount of water infiltrated through the soil. This can be proven because, for Day 1, the first site’s experiment was conducted at approximately 11.00, with a temperature of 17 degrees Celsius. On Day 3, it was done at 13.20 and the temperature was 23 degrees Celsius, which accounts for the more defined negative exponential trend in Figure 17. It is more defined because there is roughly a decrease per minute (the fourth minute being an exception), ranging from 2 to roughly 0.25 cm. In Figure 16 it fluctuates slightly, skewing the definition of a negatively exponential forming curve.
Figure 18: Lateral variations of surface
The above observations provide a great deal of information in relation to geographical and physical generalisation, with a few sets of data appearing to contradict such generalisations (e.g. Site 5, Day 3). On a conclusive note for this section, evidently temperature tends to have more of an effect when an area is either in an exposed area or is at higher elevation, with the composition and saturation of the soil playing a major role in the rate of infiltration. Humans and engineered paths (roads) have played an even more important role in affecting infiltration rates, as they affect not only the composition of the surface, but it also has a significant impact on the amount of run-off inputs into the surrounding, permeable surfaces.
IV. Conclusion and Evaluation
i. Conclusion
The original research question concerning which factors affect infiltration rates the most in Woluwe Park and their impacts has been thoroughly explored by the collection of primary data by means of basic methods. Many trends appropriately fit geographical generalisations, including the effects of vegetation and soil composition, with Day 1 Site 5 being typical for my expectations. These trends also support theory from branches of physics, which is a more descriptive and logical way of describing the process of infiltration and its factors. The significance of evaporation and its effects on the rate of infiltration proved to be situational, except for sites 1 and 6 on particular days where there was much exposure to the sun. Woluwe Park proves as a useful case study of how infiltration rates may differ in different areas. While it is very much so a natural park that has ecologically thrived on its own, it also manages to stay as an area where humans can freely walk through it, leaving the ecosystem undisturbed.
We can infer, from this data, the relevance of these variations in terms of human-ecological interaction most notably by the establishment of a recreational sports centre and impermeable roads and paths engineered by humans. It could alter the natural characteristics of Woluwe Park by, for example, reducing the amount of water vegetation receives (indicating possible increased need to regulate the amount of water they receive), or displacing animals or insects to alternative areas of the park where there may be more peace and quiet or an abundance of more natural ground. Additionally, the increases runoff could give rise to conditions rendering the park vulnerable to light flooding. This brings us to further conclude that from a human impact on nature, there is an opposing natural impact on humans of these flooding characteristics which could give rise to an increased expense or alteration in urban engineering (i.e. houses in the area to the west, Figure 2) to accommodate these changes.
ii. Evaluation
Because the method of experimentation utilised simple equipment, there were some flaws. These included the difficulty in reading the ruler because of the lack of light available. Also, readings were not carried out by the same observer: perhaps the recorder wrote the wrong figure due to miscommunication, or that the timer might have been off by five to even twenty seconds, which may have had a very significant effect on the changes in infiltration rates. Additionally, when water was poured into the cylinder, the timer was not started until about five seconds after the water had settled in, so the reader had time to obtain the original water level figure. Because water pressure is so high at maximum water level, infiltration rate generally tends to be faster, indicating a rapid change of infiltration per minute (Figure 4). Lastly, twice pond water was needed to be used due to the unavailability of extra bottles of water. Pond water has more biological and chemical composition within it. It is possible this composition may have changed the rate for some experiments.
iii. Limitations
Limitations to the experiment were primarily time and supplies available. Since the experiment required a partner to aid with transport and carrying supplies to each site, it was not easy to motivate others to help. This meant the amount of water was limited so it was not possible to repeat the experiment more than once at each site, meaning that there were fewer results available to be averaged. For example, as stated in the results for the anomalous data of Day 3, Site 5, it was possible that a different part of that specific site may have had less porous soil or shade. This raises the question of how effective geographic generalisations may be, and provokes further study in the field of infiltration rate studies to better understand this anomalous data. Occasionally, when the tube was hammered into the ground, it may have also been slanted, or not fully sealed, meaning in what should be saturated sites the water may have flown out of the bottom, giving the site an actual data trend.
iv. Improvements and Development
To further improve this fieldwork it should be done with multiple persons to so that two experiments could be done at each site to better record an average. A Plexiglas cylindrical water container would make reading the ruler easier. The experiment could be done in more of the westerly areas of the park, where housing is more abundant, to broaden the results. Finally, further investigation into the climatologic characteristics of the area would be taken into account, with possible interpolation of data as to account for past flooding and whether it had significant impacts or not.
V. Appendices
APPENDIX A: Primary Data
DAY 1
Site 1; 11:00; sunny, warm.
Site 2; 11:23; sunny.
Site 3; 11:42; cloudy, windy.
Site 4; 11:58; shaded, warm, windy.
Site 5; 12:15; warm, shady.
Site 6; 12:30; sunny.
DAY 2
Site 1; 12:33; cloudy and humid.
Site 2; 12:52; cloudy and humid.
Site 3; 13:20; cloudy and humid.
Site 4; 13:37; patches of cloud and sun, humid.
Site 5; 13:52; shady, breezy.
Site 6; 14:09; breezy, shady.
DAY 3
Site 1; 13:20; sunny, dry.
Site 2; 13:40; fairly windy, quite humid.
Site 3; 13:55; sunny, humid.
Site 4; 14:09; cool, shady, dry.
Site 5; 14:20; dry, sunny, breezy.
Site 6; 14:38; sunny.
VI. Bibliography
Atlapedia Online. Atlapedia. 20 Oct. 2007 <http://www.atlapedia.com/online/countries/belgium.htm>.
Bayliss, Tim. “Drainage Basins and Storm Hydrographs.” Geography to GCSE. Oxford University Press, 1998. 118-119.
“Climate averages; Brussels, Belgium.” EuroWEATHER. 20 Oct. 2007 <http://www.eurometeo.com/english/search>.
Holmes, David, and Warn Sue. "Field assessment of soil texture." Fieldwork
Investigations: Self Study Guide. N.p.: Holder Murray, 2003. 108.
"Hydrologic Cycle." The Physical Environment. University of Wisconsin, Stevens
Point. 14 Sept. 2007 <http://www.uwsp.edu/geo/faculty/ritter/glossary/
h_k/hydrologic_cycle.html>.
Mannion, Antoinette M., et al. “Soil Physical Properties and Porphology.” Processes in Physical Geography. New York: Longman, 1986. 213-240.
Nagle, Garrett, and Kris Spencer. “Drainage Basin Hydrology.” AS & A Level Geography (through diagrams). 3rd ed. AS & A Level Geography. Oxford University Press, 2001. 27.
“Parc de Woluwe.” Map. Brussels. 29 June 2007 <http://www.ecli.net>. Path: Bienvenue; Geographique; Parc de Woluwe.
Ross, Simon, John Morgan, and Richard Heelas. “Soils.” Essential AS Geography. Ed. Simon Ross. Cheltenham: Stanley Thornes, 2000. 92-100.
Voies Hydraliques. 6 Oct. 2007 <http://voies-hydrauliques.wallonie.be/hydro/statintro.do>.
Waugh, David. “Soils.” Geography: An Integrated Approach. 3rd ed. Geography: An Integrated Approach 3. Cheltenham: Nelson Thornes, 2002. 260-285.
The Weather Underground. 19 July 2007 <http://www.wunderground.com/>.
Wilcock, David. “Weathering and Slopes.” Physical Geography: Flows, Cycles, Systems and Change. Glasgow: Blackie and Son, 1983. 34-37.
University of Wisconsin, Stevens Point website http://www.uwsp.edu/geo/faculty/ritter/glossary/h_k/hydrologic_cycle.html
The Weather Underground. 19 July 2007 <http://www.wunderground.com/>.