7. Data Presentation + Analysis:
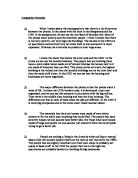
First, to address building height, I have compiled bar charts to show how the heights change in each of the 4 transects for both the left and right-hand side:
Analysis:
By observing the graphs we can notice that some transects do indeed show that as distance from the CBD increases, the height of buildings in general, decreases (hypothesis IV).
Certainly in the northern transect (Figure 7.1) this was the case, as the bars clearly show a downward trend. For the southern transect (7.2), this was less apparent. To the west (7.3), on the left-hand side there is a decrease in heights, but for the right-hand side, the heights remain similar with the exception of the anomaly of the tall KBC building (one of the first skyscrapers in Europe – Figure 7.5). In the eastern transect (7.4), no apparent trend can be seen.
It must be also noted that as we were conducting the field study, it was noticeable that many of the buildings close to the Rooseveltplaats seemed very old, and as we reached the final steps of our assigned transects, the buildings appeared to be somewhat newer or renovated.
Certainly nowadays there are architectural limitations by the council that restrict the construction of taller building near the Rooseveltplaats. Antwerp is a very old and culture-rich city and it would be impossible to gain permission to tear down old buildings near the Rooseveltplaats and erect new ones that are outside the limitations. One example of a time when it was permissible to construct tall buildings is the Antwerp Tower, (built in 1974)2 (can be seen as the first building on the northern transect diagram).
These results do to some extent, though not clearly, support hypothesis V, and can somewhat help in delineating the edge of the CBD (aim I, II, hypothesis I).
In order to see how land use varies, I have compiled pie charts for each of
the four transects showing the various percentages of land use:
Analysis:
Although this data does not exactly show us how land use varied with distance from the CBD (hypothesis II), we can see very well that certain transects have greater proportions of office/retail than others.
From the graphs above, it can be deduced that the western transect has a large proportion of commercial land use, in comparison with the rest of the transects (this is understandable as the main shopping street of Antwerp, the Meir, is located along the transect).
Moreover, the southern transect has the greatest proportion of office space, when compared to the other transects. Both the eastern and the northern transect have greater percentages of residential land use - hinting that perhaps the CBD doesn’t expand as far East and North, as it does to the South and West.
In order to investigate this further, I have attempted to produce a map on the following page that would show a block-by-block (block = 200 meters) analysis of the varying land usage for each of the four-transects. The map gives us a better understanding of perhaps where the border of the CBD is – once proportions of office and retail space drastically fall. My analysis for this map is based upon the concept that where the ratio of shops to other properties is 1:3, or ratio of offices to other properties is 1:10, then that area should be counted as being within the CBD4 (aim I, hypothesis II).
Possible errors and limitations that occurred whilst gathering and analyzing the data included the problem of not being able to tell what the land use was at higher floor levels (perhaps it would be better to use only bottom floors). Another problem was that some “home offices” were a split between residential and office, and the “others” category. For the purpose of this study, banks and building societies were included in office count.
MAP1LANDUSAGE
MAP2PED+CARCOUNT
To be able to see how pedestrian counts differ with distance from the presumed CBD, I will be using line graphs (a pedestrian was defined as someone of school age and over walking along or in the transect):
Analysis:
These graphs, combined with the map on the previous page, shows that in almost all instances, as distance increased, the pedestrian count decreased. In the northern transect this is very clear, as can be seen by the nearly strait downwards line in the graph. Also by looking at the map, it can be seen that the larger clusters of people were located in or near to the Rooseveltplaats.
Significant observations can be made about the western transect, where pedestrian count remained very high in the initial stages – this is because Antwerp’s main shopping street, the Meir), was located in the beginning.
This analysis supports hypothesis III, where we stated that indeed the pedestrian count would decrease with distance from the CBD (aim I).
To see how traffic counts vary with distance from the presumed CBD area, we will use bar graphs:
Analysis:
Although for the eastern and the southern transect there appears to be evidence of an inverse relationship between distance from the CBD and the traffic count, for both the western transect and the northern transect, there is no such pattern. These bar graphs help us understand that perhaps the edge of the CBD is further out to the west and north, then the south and east, where the traffic counts clearly started to drop. Also it must be recognized that authorities are continuously trying to decrease the amount of traffic and congestion around the Rooseveltplaats.
These graphs do not support our hypothesis III, where we claimed that traffic counts would decline with distance from the CBD.
MAP3HOTELS
Statistical Test:
I will be using Spearman’s rank correlation method to see if there is a close relationship between hotel prices and the distance of the hotels from the Rooseveltplaats. Although we could draw a scatter graph and look for a relationship there, the more precise method to look for a relationship between the two sets of data would be a statistical test. My null hypothesis is that there should be no relationship between the two variables (hypothesis IX).
The method for calculating the coefficient includes first ranking the two sets of data and then finding the differences in the ranks (given by d). Once the differences have been squared (d2), they must be summed (Σd²). Lastly, by using the formula below, the coefficient can be obtained:
After I ranked the two sets of data and had Excel (sheet attached in Raw Data Sample section) calculate the coefficient, I obtained the value of:
0.340
Keeping in mind that the figure had to be between -1 (very strong negative relationship) and 1 (very strong positive relationship), it can be concluded that the relationship between the distance from the CBD, and the price of the hotels, has a fairly weak positive relationship. When evaluating the validity of this test, one must keep in mind that it is possible that the relationship occurred by chance and there may be no significance to the relationship. Also, although 15 is the minimum amount needed in a sample in order for the rank to be valid, I have used all available 30 hotels – thus increasing significance.
By using this data, and the map provided on the previous page, I have shown that although there is a significant weak relationship between the price of the hotel and its distance from the CBD (hypothesis VI, aim II), there seems to be a trend for hotels, both expensive and inexpensive, to cluster around the Rooseveltplaats and its surrounding areas.
Sampling:
It is important to consider the benefits that sampling gives us. If, for example, we wanted to examine a distribution of Muslims or Jews in Antwerp in order to gain better knowledge of the distribution of ethnic groups and the percentage that live within the CBD, it would be impossible to interview all the residents – however we could sample a cross-section. We would not be able to gain access to the complete population as it would take too long and be very expensive and near-impossible and most of the time it is unnecessary to measure the whole population if a good random sample can be found. Sampling has various benefits, many of which are largely discussed in Barnaby Lenon’s “Fieldwork Techniques and Projects in Geography”.5
MAP4PARKING
Analysis:
The map on the previous page allows us to see that indeed the distribution of parking prices is regular. There seems to be a cluster of parking lots, both expensive and inexpensive, around the Rooseveltplaats region. There are practically no parking places to the north, south and east, however still a significant number of cheap and expensive parking lots to the west. This can be explained by the fact that there is a small mall and most of Antwerp’s shops are located there, along with the majority of the city’s cultural tourist attractions. This data supports hypothesis V, where we claimed that parking prices would decrease with distance from the CBD – as the map shows.
8. Conclusion - Delineating the CBD:
Having gathered all the data and analysis possible given the restraints, I feel I have enough adequate data to define the CBD boundaries from its center at Rooseveltplaats (aim I). Referring back to Burgess Model where the CBD is the social, commercial and cultural heart of the city, often dominated by department stores, shops, offices and hotels, I am confident of outlining this spot in Antwerp. Taking into account details such as: there was more retail and office space in the west and also south, there was a substantial amount of hotels and parking lots near Rooseveltplaats but many were located to the west and south, there were declining traffic and pedestrian counts as distance increased for both south and west, and so forth, I have been able to estimate the shape and spread of the CBD.
This is shown on the following map, though it must be noted that however accurate our data and analysis was, fieldwork like this will show that the “clear-cut boundary” that Burgess developed is in practice very hard to find and is more likely to be an area that merges into the next zone (aim I, II). For this very reason, I have included on the map the area that I think most probably lies within the CBD, but also possible “grey-areas” that show some, but not enough, characteristics of being within CBD. We need to take into consideration that authorities would want residential buildings close to offices, redusing the amount of traveling.
Perhaps we could look into the idea that there is more than one CBD in Antwerp, or that the CBD is not a circular zone but more of an ellipse (as my delineation seems to suggest). In fact, when researching the CBD of Antwerp on the internet, I found one source claiming it is “the area between the river Scheldt and the Central station”6. This is very much in line with what my delineation suggest, as we can clearly see an ellipse shaped zoned going from just northeast of the Rooseveltplaats (where the station is) all the way down west to almost where the river is.
MAP5DELINEATION
9. Evaluation:
One must keep in mind that for the most part, we only investigated 4 separate transects of the city which, for a place like Antwerp that is home to more than half a million people, is understandable because mapping the whole city would be too difficult. It would have been more appropriate to do 8 or more transects, considering there were actually that many streets leaving Rooseveltplaats – perhaps that hypothesis needs to be reworked.
The methods that appeared to give the most accurate delimitation of the CBD were the land use models, pedestrian counts and parking places map. The method that gave the least effective result was the building height analysis. Assumptions that each storey is the same height in meters is a limiting factor
It must be recognized that in this town, although there was an obvious CBD, we had no clear-cut boundaries. The area of the CBD was however similar to my preconceived picture of its limits.
If I were to repeat this investigation then I would certainly attempt to include the Central Business Index as a technique as it involves a combination of land use characteristics, building height and land values. It was not used because we had problems obtaining total floor and ground areas for the buildings. Another refinement to the techniques used would be to obtain old maps of Antwerp and see whether the CBD has been shifting.
10. Bibliography
Waugh, David. Geography: An Intergrated Approach. Third Edition. Cheltenham, England: Nelson Thornes, 2002.
Lenon, Barnaby, and Paul Clevens. Fieldwork Techniques and Projects in Geography. 1st ed. London: HarperCollins, 1994.
Flint, Corrin, and David Flint. Urbanisation: Changing Enviroments. 2nd Edition. London: HarperCollins, 1998.
Antwerp Facts." Antwerp. 8 January 2007. Wikipedia. 11 Jan 2006 <http://en.wikipedia.org/wiki/Antwerp>.
"Antwerp." A view on cities - Antwerp. 3 Jan 2007. Aviewoncities. 11 Jan 2007 <http://www.aviewoncities.com/antwerp.htm>.
11. Example of Raw Data:
Northern Misc. data
Hotel + rank correlation data: