-
METHODS AND DATA SELECTION
Before the investigation, some information concerning the methods for collecting data is needed to be explained. As said in the introduction, the two methods used are called random and systematic samplings. The sample has to be carefully chosen in order to represent the results in the best possible way. The countries were 239 and taken from the “Data Finder” application on the following website: www.prb.org.
With the first method, the random sampling, all countries have an equal chance of inclusion in the sample. This technique ensures that bias is not introduced. The advantage of random sampling is that it is easy and simple to apply when small groups are involved. Usually, it can not be used for large populations. To form the first group, 25 countries were selected in an unsystematic way using this method.
The second method, systematic sampling or interval sampling, implies a constant gap or interval between each selected country. This type of data collection avoids any bunching and it also gives a good spread right across the population. Although simple and easy to apply, it can introduce bias into the results. In a regular manner, every 7th country of the list composed the second group of 25 elements. Sometimes data were unavailable for some countries, so the next ones with data were chosen.
The information was collected for each country of both groups with reference to the following data:
- Lifetime Births per Woman (TFR) from “Population Trends variables” to evaluate the aspect related to the fertility rate;
- Secondary School Enrolment, Female, 1990 (as % of school-age male enrolment), from “Education variables”, to analyze the educational aspect.
To show the strength of the relationship between the two variables and any exceptions, the Spearman’s statistical method, called the rank correlation coefficient, will be used.
Two scattergraphs will be produced to see what the correlation is.
The results will be presented in the next paragraph.
4. PRESENTATION OF RESULTS
Before the analysis, the information of all the data are needed.
The values of the first group’s countries are presented in the table below. As illustrated, it contains one column showing the selected countries and other two columns which represent respectively all the information related to the educational aspect and to the fertility rate taken in consideration.
Table n 1. Secondary school enrolment and TFR per woman in the 25 countries of the random sampling group.
As the first table of results, this following table also represents all the data needed for the last analysis and interpretation but related to the second group of countries.
Table n 2. Secondary school enrolment and TFR per woman in the 25 countries of the systematic sampling group.
Graph 1. Relationship between “Secondary school enrolment, female, 1990” and “Lifetime births per woman” in the first group of countries.
Graph 2. Relationship between “Secondary school enrolment, female, 1990” and “Lifetime births per woman” in the second group of countries.
Both the above Scattergraphs with their “best-fit lines” show that there is a fairly good negative correlation between the two analysed aspects. To quantify and prove it, the Spearman’s rank correlation coefficient is found.
Table n 3. Ranked data for Secondary school enrolment, female, 1990 and TFR for the first group’s countries.
At the end, calculating using the Spearman’s formula, the results is: -0.676, which means it is negative.
Table n 4. Ranked data for Secondary school enrolment, female, 1990 and TFR for the second group’s countries.
By Spearman’s formula, the result is: -0.687, which again means negative correlation.
5. INTERPRETATION AND ANALYSIS
From the statistical methods used, the data and the consequent results are identified and explained.
The answer to the research question is that the relationship between TFR and the level of education of women presents a quite negative slope. This means that, as the educational levels’ value raise, the TFR values drop. In this way, the hypothesis made at the beginning is confirmed. From the scatter graphs it is clearly visible that Bangladesh and Dominican Republic are exceptions.
In the poorest countries, such as Bangladesh, Gambia, Iraq, Togo, Burkina Faso, Chad and Mauritania, the status of women is considerably low. These societies, whose life conditions are extremely poor, isolated from the modern way of life, at least in the way it is defined to be in the industrialized countries, a wife is primarily considered as an investment for production of labour childbearing housekeeper. The lack of education is one of the most important aspects to keep in consideration when thinking of women’s discrimination: families are less likely to educate girls than boys. The women’s educational level is also one of the best way to predict how many children she will have and it is a very critical factor in accounting for lifetime fertility differentials. According to the data, those countries facing less development levels in 1990 had their secondary school enrolment for females below 59 and their TFR values above 4.0; the lowest value was found Yemen(21) with 6.2 value for the TFR.
The highest value for literacy levels reaches 136 (Dominican Republic), which is the outlier.
6. CONCLUSION
The study has an attempt to underline the correlation between the important aspects of total fertility rate and the level of education of women in different countries.
It has deeply studied and analysed the different statistical methods used the techniques that helped seeing the correlation. The hypothesis has been demonstrated and confirmed through the data collected: the higher the literacy levels the lower the TFR. It has been noted how these two features can affect a country’s development and its growing in terms of population. But it is difficult to determine direct causation. Some data may be merely caused by different societies, backgrounds and life styles. An example can be demonstrated by the Eastern countries, where their culture does not allow women to live in a facilitated status like men. Overall, it seems that the correlation is moderately negative.
The analysis could have been more accurate if more countries were taken in examination, so that more data were available and the results could have been stronger. A deepest investigation on the development of the countries could also be an option for a precise outcome.
INDEX
1. RESEARCH QUESTION AND HYPOTHESIS p. 1
2. INTRODUCTION p. 1-3
3. METHODS AND DATA SELECTION p. 3-4
4. PRESENTATION OF RESULTS p. 4-9
5. INTERPRETATION AND ANALYSIS p. 9
6. CONCLUSION p. 10
BIBLIOGRAPHY p. 11
BIBLIOGRAPHY
- David Waugh, “Geography An Integrated Approach”, Third editinon, Nelson House, 2000 United Kingdom.
- http://www.abs.gov.au/websitedbs/d3310116.NSF/4a255eef008309e44a255eef00061e57/116e0f93f17283eb4a2567ac00213517!OpenDocument.
LIST OF ILLUSTRATIONS
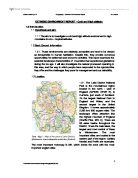
Map 1. Highlighted countries in the group of the random sampling method ,p.2 .
Map 2. Highlighted countries in the group of the systematic sampling method, p.2..
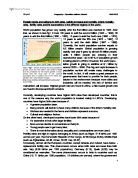
Map 3. Brandt line map to demarcate economically and politically developed and developing countries, p.3.
Table n 1. Secondary school enrolment and TFR per woman in the 25 countries of the random sampling group, p.5.
Table n 2. Secondary school enrolment and TFR per woman in the 25 countries of the systematic sampling group, p.5.
Table n 3. Ranked data for Secondary school enrolment, female, 1990 and TFR for the first group’s countries, p.8.
Table n 4. Ranked data for Secondary school enrolment, female, 1990 and TFR for the second group’s countries, p.9.
Graph 1. Relationship between “Secondary school enrolment, female, 1990” and “Lifetime births per woman” in the first group of countries, p.6.
Graph 2. Relationship between “Secondary school enrolment, female, 1990” and “Lifetime births per woman” in the second group of countries, p.6.
http://www.abs.gov.au/websitedbs/d3310116.NSF/4a255eef008309e44a255eef00061e57/116e0f93f17283eb4a2567ac00213517!OpenDocument.
http://www.abs.gov.au/websitedbs/d3310116.NSF/4a255eef008309e44a255eef00061e57/116e0f93f17283eb4a2567ac00213517!OpenDocument.
David Waugh, “Geography An Integrated Approach”, Third editinon, Nelson House, p. 635, 2000 United Kingdom.