
In this portfolio,my assignment is to deal with matrix binomials,and to investigate them.
PORTFOLIO TYPE I - MATHEMATICAL INVESTIGATION -MATRIX BINOMIALS- Student: Domazet Neven SL In this portfolio,my assignment is to deal with matrix binomials,and to investigate them. At first,my initial matrices are as follows: and Now,my task is to find and calculate following matrices: : X2, X3, X4; Y2,Y3 and Y4 So,since and we will calculate that as We know that we can express multiplication of matrices as ,and it goes like ,so we get that , thus. Or 2* =2* X As we now know this,it is easy to calculate ,because or 2*X*X,which is 2*2*X or it is equal to 22*X and equal to . is defined as X3*X=22 *X*X=22 *2*X=23 *X and our solution is = Procedure for Y is completely the same as for X,and we do not have to go in details,so to calculate the products of , and , we will use the TI-84 Plus Texas Instruments Graphic Calculator and obtain the results in the following form ( [B] equals Y) The results are as follows: ; and . Now to continue with our work we need our previous results,because they can help us to find , and .Results are shown in table below Here we can see some characteristics which can help us in our work,and we will stick to them,and applying the rule to the results we will get the following matrix identities: ; ; ; . If we express every coefficient as ,we get ; ; ; . Next table that can help us is the one dealing with

Investigating the Ratios of Areas and Volumes around a Curve
Investigating the Ratios of Areas and Volumes around a Curve Introduction: In this investigation I will examine how changing the power of a function changes the ratio of the areas between it and the two axes. I will begin by making assumptions to simplify the mathematics, and then move on to more general cases. The curve used throughout will be, and I will aim for an expression of an area or volume ratio in terms of n. Notes: As the end goal in my investigation is to find a (unitless) ratio, I have left units out of my calculations. For all areas these can be given as 'units2', in whatever unit the particular graph is drawn. Volumes would be measured in 'units3'. All diagrams have been produced on Autograph V3.20, and modified slightly to add labels/shading in Microsoft Paint. A simple case: The curve is drawn between x=0 and x=1. The region between y=0, y=1, the curve and the y-axis will be known as A, and the region between x=0, x=1, the curve and the x-axis will be known as B. The ratio A:B can be calculated using the power rule for integration; to calculate A the equation is rearranged into the form ; the limits remain the same when raised to this power: Thus for n=2, A:B=2. To try and detect a correlation, this can be attempted with other values of n, using the same limits. For n=3, between x=0 and x=1: For n=4, between x=0 and x=1: Further examples: Thus

Type 1 Portfolio: Matrix Binomials
Type 1 Portfolio: Matrix Binomials Hudson Liao 2/7/2008 I was given the expression X = and Y = , where I calculate X2,X3,X4;Y2,Y3,Y4. Below I calculated X2 and made my way up to X4, where I also did the same with Y2 to Y4. X2= X3 or X2 * X1 = X4 or X3 * X1 = Y2 = Y3 or Y2*Y1 = Y4 or Y3+ * Y1 = Xn X1 = 1X = 20X X2 = 2X = 21X X3 = 4X = 22X X4 = 8X = 23X Now I am going to find and expression for: [Xn, Yn, (X+Y)n], by inputting different 'n' values. By doing this I can find a correlation between each variable. Expression: Xn = 2(n-1) X This general statement was found by finding a relationship through values from X1 to X4. In the Xn table, a pattern begins to form from 1X, 2X, 4X and 8X. If we simplify these numbers by using a constant value such as 1X = 20X we can find a general statement for this expression. Yn Y1= 1Y = 20Y Y2= 2Y = 21Y Y3= 4Y = 22Y Y4= 8Y = 23Y Expression: Yn = 2(n-1) Y The same method to determine the general statement for the expression Xn = 2(n-1) X was also used for Yn = 2(n-1) Y. (X+Y)n 2I 4I 8I 6I I am going to determine the expression for (X+Y)n by letting X = and Y = . Therefore the expression would look like: The resultant matrix is I am going to prove that this expression works with (X+Y)n : Calculation: (X+Y)n n=2 My expression: (X+Y)2 = 22I = With (X+Y)n: As well, since 'X' and 'Y'
Math Portfolio - Type II
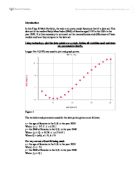
Introduction In this Type II Math Portfolio, the task is to create model functions that fit a data set. This data set is the median Body Mass Index (BMI) of females aged 2-20 in the USA in the year 2000. It is then necessary to comment on the reasonableness and differences of these models and how they compare to the data set. Using technology, plot the data points on a graph. Define all variables used and state any parameters clearly. Logger Pro 3 (LP3) was used to plot and graph points. Figure 1 The variables and parameters used for the data points given are as follows: x = the age of females in the U.S. in the year 2000 Where { x ????????????x ? 20 } y = the BMI of females in the U.S. in the year 2000 Where { y ??Q ????????????y ? 21.65 } Where Q = (a/b), a ??N, b ??N For any curves of best fit being used: x = the age of females in the U.S. in the year 2000 Where { x ????} y = the BMI of females in the U.S. in the year 2000 Where { y ??Q } Where Q = (a/b), a ??N, b ??N What type of function models the behaviour of the graph? Explain why you chose this function. Create an equation (a model) that fits the graph. There are a few functions that may model the behaviour of the data points. One of these is the quintic function. This function was chosen because within the set parameters it models the points with little error. Using LP3: Therefore according to

Infinite Summation Internal Assessment The idea of this internal assessment is to investigate the effect changing the value of x and a have on the graph of the general sequence given.
Shin Park January 20, 2011 Lancaster 3rd Infinite Summation Internal Assessment The idea of this internal assessment is to investigate the effect changing the value of x and a have on the graph of the general sequence given. In able to observe and display the following graph and tables, Microsoft Excel took action during this investigation. It is also vital to take note of the scatter plot lines with connected dots of the values of at the different values of is used for visual assistance to help understand the affect and. The notation of is the sum of the terms and is the number of the term in the sequence. The sequence that will be examine to determine the effect of different values of x and a is =1, =, = , = ..., = ... The first variation of the sequence that will be observed is, 1,,, with x = 1 and a = 2. n Sn 0 .000000 .693147 2 .933374 3 .988878 4 .998496 5 .999829 6 .999983 7 .999999 8 2.000000 9 2.000000 0 2.000000 = The table shows the value of, which is sum of the terms in the sequence, which gradually increase to 2, but never passes 2 regardless of the value of n increasing. The graph above displays x=1 a=2 in the sequence and how its sum affects this line. which is the x-axis, shows that never passing through 2 because 2 is the horizontal asymptote, thus even if the value of n increases, would still be smaller than 2.

Investigating Ratios of Areas and Volumes
Introduction In this portfolio, I will investigate the ratio of areas formed when y = xn is graphed between two arbitrary parameters x = a and x = b such that a < b. Ratio of Area Given the function y = x2, I will first consider the region formed by this function from x = 0 to x = 1 and the x-axis. The region will be labeled B. The region from y = 0 to y = 1 and the y-axis will be labeled A. A diagram of this is show below: Finding the ratio of area A: area B: By integrating this function from x = 0 to x = 1, we can find the area under the curve, area B. B = = = - 0 = Since the total area of area A and B is 1, we can simply subtract the area of B from 1 to get area A. A = 1 - = Thus the ratio of area A: area B is 2:1. Now, I will consider the ratio of areas for other functions of the type y = xn, between x = 0 and x = 1. Function Area of B (under the curve) Area of A Ratio y = x3 = = - 0 = - = 3:1 = 3 y = x4 = = - 0 = - = 4:1 = 4 y = x5 = = - 0 = - = 5:1 = 5 The graphs of these functions are shown below: After considering several examples of the function of the type y = xn, between x = 0 and x = 1, a clear pattern emerges. The pattern for the ratio seems to be n:1 or just n. Proof of Conjecture: = = - B = A = 1 - = - = A: B = : = n:1 = n To test the conjecture, I will now consider other values of n by
Odd and Even Functions Portfolio
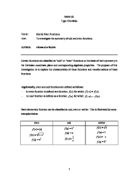
Maths SL Type I Portfolio TOPIC: Odd & Even Functions. AIM: To investigate the symmetry of odd and even functions. AUTHOR: Aleksandra Rodzik Certain functions are classified as "odd" or "even" functions on the basis of their symmetry in the Cartesian coordinate plane and corresponding algebraic properties. The purpose of this investigation is to explore the characteristics of these functions and transformations of these functions. Algebraically, even and odd functions are defined as follows: - An even function is defined as a function for which . - An odd function is defined as a function for which . Each elementary function can be classified as odd, even or neither. This is illustrated by some examples below. even odd neither f (x) = x2 f (x) = x3 f (x) = x f (x) = 1 f (x) = 2x To verify whether a given function is even, odd or neither, you have to plug -x for x and simplify. If the result obtained is exactly the same as the formula given, then the function is even (f(-x) = f(x)). If the result is the opposite of the formula, then the function is odd (f(-x) = -f(x)). Finally, when the result is utterly different from the formula given, the function is neither even nor odd. The examples will be now followed by calculations. f(x) = |x| f(-x) = |x| f(x) = f(-x) even function => As the absolute value cannot be negative f(x) = V(1-x2) f(-x) =
Maths HL Type 1 Portfolio Parabolas
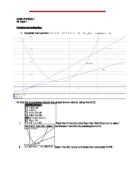
Maths Portfolio 1 HL Type 1 Parabola Investigation . Consider the function To find the four intersections in the graph shown above using the GDC, i. Press the 2nd button and then the TRACE button to select the CALC function. Select the intersect function by pressing button 5. ii. Select the first curve of intersection and press ENTER. iii. Select the second curve of intersection and press ENTER. iv. Select the area of estimation of the intersection point and press ENTER. v. The first intersection point between Repeat the above steps i-iv, to obtain the other intersection points between . The second intersection point between The first intersection point of The second intersection point of The To find the values of , To calculate the value of , 2. To find other values of D for other parabolas of the form ,with vertices in quadrant 1, intersected by the lines Consider the parabola and the lines , The intersections of the parabola with the lines can be calculated using both the GDC and manual calculation. By manual calculation, To calculate the intersection between , Sub (2) into (1), Sub Sub The intersections between the parabola are (3,3) and (6,6). By using the GDC, To calculate the intersection between i. Key in equations of into the GDC, ii. Press the TRACE button to plot the graph on the GDC, iii. Press the 2nd button and the
Virus Modelling
IB HL Maths Modelling the Course of a Viral Illness and its Treatment Candidate Name: Sherul Mehta Centre Number:002144 Candidate Number: CSY 114 Contents Introduction - - - - - - - - - - - - - - - - - - - - - - - - - - - - - - - - pg3 Modelling infection * Part 1. - - - - - - - - - - - - - - - - - - - - - - - - - - - - - - - - - - pg4 * Part 2. - - - - - - - - - - - - - - - - - - - - - - - - - - - - - - - - - - pg7 Modelling Recovery * Part 3. - - - - - - - - - - - - - - - - - - - - - - - - - - - - - - - - - pg11 * Part 4. - - - - - - - - - - - - - - - - - - - - - - - - - - - - - - - - - pg16 * Part 5. - - - - - - - - - - - - - - - - - - - - - - - - - - - - - - - - - pg18 * Part 6. - - - - - - - - - - - - - - - - - - - - - - - - - - - - - - - - - pg20 Analysing your models - - - - - - - - - - - - - - - - - - - - - - - -pg24 Applying your model * Part7. - - - - - - - - - - - - - - - - - - - - - - - - - - - - - - - - - pg26 Introduction Through this coursework I will investigate the case of a standard adult patient who is infected by a virus and produce models to explain the entire process. I will look at the replication rates of the virus at different stages. Then I will show what happens when the immune response begins and how to eliminate the viral particles. Then I will show how and when medicine can be administered and I'll portray its effects on the
math
* Statement of task Firstly I need to get information about the machinery from the company. To get it from a very reliable source I will get the bills of the two machines bought in 2007 from the company's accountant. After that I will start working on the project. Initially I will first find the total individual cost of both the machines from the bills provided by the accountant. Then review the present book value of the machine after it has depreciated for two years, provided by the accountant. To calculate the rate of depreciation from the data provided by the accountant I will use the formula of reducing balance depreciation. * The formula used to calculate the reducing balance depreciation is BVt= C ((1)-(rate/100)) ^n Note - n represents the number of years. Thus now I can use the present book value to calculate the rate at which the machine has depreciated. I will substitute the current book value in place of BVt in the equation. Then substitute C with the cost of the machine and substitute 2 in place of n as the current book value provided by the accountant is as of 2 years. I can then solve the equation in order to find the rate in a Graphic Display Calculator (GDC). After I have the rate I can now forecast the depreciation for the machinery. So to have more accurate and less uncertain data I will calculate and create a depreciation schedule from 2