= 0.3005 + 0.3025 + 0.3065 + 0.3125 + 0.3205 + 0.3305 + 0.3425 + 0.3565 + 0.3725 + 0.3905
= 3.335
(4 significant figures were used to demonstrate the difference between n= 8, n= 10)
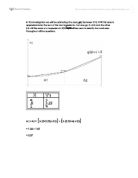
A₁ + A₂ + A3 + A4 + A5 + A6 + A7 + A8 +A9 + A10 + A11 + A12 + A13 + A14 + A15 + A16 + A17 + A18 + A19 + A20 =
(½ (3+3.002) x 0.05) + (½ (3.002+3.01) x 0.05) + (½ (3.01+3.02) x 0.05) +
(½ (3.02+3.04) x 0.05) + (½ (3.04+3.06) x 0.05) + (½ (3.06+3.09) x 0.1) +
(½ (3.09+3.12) x 0.05) + (½ (3.12+3.16) x 0.05) + (½ (3.16+3.20) x 0.05) +
(½ (3.20+3.25) x 0.05) + (½ (3.25+3.30) x 0.05) + (½ (3.30+3.36) x 0.05) +
(½ (3.36+3.42) x 0.05) + (½ (3.42+3.49) x 0.05) + (½ (3.49+3.56) x 0.05) +
(½ (3.56+3.64) x 0.1) + (½ (3.64+3.72) x 0.05) + (½ (3.72+3.81) x 0.05) +
(½ (3.81+3.90) x 0.05) + (½ (3.90+4) x 0.05) =
= 0.1500 + 0.1503 + 0.1508 + 0.1515 + 0.1525 + 0.1538 + 0.1553 + 0.1570 + 0.1590 + 0.1613 + 0.1638
+ 0.1665 + 0.1695 + 0.1728 + 0.1763 + 0.1800 + 0.1840 + 0.1883 + 0.1928 + 0.1975
= 3.3337
As the number of trapeziums increases the area beneath the curve g (x) = x2 + 3 appears to be approaching the value 3⅓ and the approximated area gets closer to this value as n increases.
This can be justified by the fact that the more trapeziums you use the more accurate the upper edge of the trapeziums are to actually representing the curve.
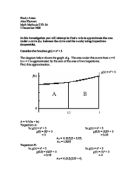
The diagram below was used to find the general expression for the area under the curve g from x=0 to x=1 using n trapeziums.
From the above diagram the following values are obtained:
D = b – a
D = nh
nh = b – a
∴ h =
b = 1, a = 0
b – a = 1
∴h =
Following the general technique used above:
Total Area ≈ A1 + A 2+ A3 + A4 + A5 + ………………….. +An
= (g0 + g1) + (g1 + g2) + (g2 + g3) +..................................+ (gn-1 + gn).
= ((g1 + g2) + (g2 + g3) + (g3 + g4) + ...........................................+ (gn-1 + gn)).
= (g0 + gn + 2g1 + 2g2 + 2g3 + ..........................................+2gn-1 +gn).
Total Area ≈∫ f(x) dx
∴ dx ≈ (g0 + gn + 2(g1 + g2 + g3 + .......................................+gn-1) ). Equation [1]
Let c ≈ (g1 + g2 + g3 + ..........................................+gn-1).
C is the sum from n=1 using sigma summation notation.
C =
∴ dx ≈ (g0 + gn + 2).
From the general case for g(x), we will be calculating the area under the curve for f (x) from x=b to x=a using n trapeziums.
From the diagram above:
D = b –a
D = nh
∴h =
Using the following notation:
f(a) = f0
f(a + h) = f1
f(a+2h) = f2
f(a+(n -1)h) = fn – 1
f(b) = fn
This follows a similar derivation as for g(x) from 1 to 0.
The following formula comes from equation [1] above, this can be used because the derivation for g(x) and f(x) is similar, the only difference being instead of saying b-a=1 we just use b-a in the expression.
∴ dx ≈ (f0 + fn + 2f1 + 2f2 + ..........................................+2fn-1).
≈ (f0 + fn + 2(f1 + f2 + ..........................................+fn-1)).
Now using similar sigma summation notation as we did for g(x).
∴ dx ≈ (f0 + fn + 2).
Using the general expression derived above, find the area under the curve when n=8, b=3, a=1
∴h =
=
n=
Subbing these values into the general formula.
∴ dx ≈ (f0 + f8 + 2).
for y1 =
Using the same notation as in the derivation:
(therefore) f(a) = f0
f(a + h) = f1
f(a+2h) = f2
f(a + 3h) = f3
f(a+4h) = f4
f(a + 5h) = f5
f(a+6h) = f6
f(a + 7h) = f7
f(a + 8h) = f8
Subbing the general formula:
∴ dx ≈
≈ (0.629 + 1.310 + 2(0.731 + 0.825 + 0.914 + 1 + 1.081 + 1.160 + 1.236)).
= 1.979
Similarly for Y2 =
∴ dx ≈
≈ (2.846 + 4.5 + 2(3.399 + 3.837 + 4.156 + 4.365 + 4.484 + 4.534 + 4.534)).
= 8.245
Finally Y3 = 4x3 – 23x2 + 40x -18
∴ dx ≈
≈ (3 + 3 + 2(3.875 + 3.75 + 3 + 2 + 1.125 + 0.75 + 3)).
= 5.125
Using a GDC the actual areas were calculated.
∴ dx = 1.98
∴ dx = 8.25
∴ dx = 4.67
Working out the percentage difference between actual values - the values from the trapezium method. The percentage was calculated like this:
-
x 100 = 0.50%
-
x 100 = 0.50%
-
x 100 = 9.74%
There isn’t much change in the percentage difference for function a and b, because the shape of the curve follows a constant pattern. However function c has a much bigger percentage difference because the function changes rapidly.
The limitations of the derived general statement of the trapezium rule from x=b to x=a are explored below using the sin (x) function. This function was chosen as it is a periodic function, it has x values that correspond to a negative y value, and changes rapidly with x. The following three graphs explore the limitations the trapezium rule has when dealing with a function like sin (x).
Using the trapezium rule for sin(x) for b = 2π and a=0, and n=4. This gives a total area of zero. As there is the same amount shaded above the x-axis as there is below. This is equal to the actual answer of zero. However this accuracy occurs only by chance. Because the same error between the shaded area and the actual area is the same above and below the x-axis. These errors cancel each other out and we get the correct answer.] However this is not always the case, as seen in the following curves.
The shaded area above, is the use of the trapezium rule for sin (x) from b=3π to a=0 using n=2. Clearly the shaded area does not equal the actual area. For instance the shaded is negative, but the actual area is positive. This occurred because the middle point of the graph is negative.
The above shaded area is for sin (x) for b=π to a=0 and n=2. Here the trapeziums represent the curve more accurately compared to the other two graphs. However the trapeziums will not give you an accurate area of the curve because as you can see above there is an area above the trapeziums that is not being calculated.
GENERAL STATEMENT:
- The general statement accurately represents the area under the curve from b to a, if
- The curve doesn’t change rapidly with x, for example the following two curves demonstrate this for n=2.
- The larger the area you are examining the larger the value of n has to be in general
- [basically b-a/2n has to be a small value, in the examples above the value of 1/8 gave an error of about .5%, therefore it would be expected that if b-a/2n was of about this magnitude the trapezium rule would give an accurate fit of the area under the curve from b to a.
- Significant figures, because there is a difference in values, there wasn’t a set number of significant figures.
- The general statement doesn’t work, if b-a/2n is large
- For functions that change periodically, i.e. sin (x), and if you take trapeziums that are larger than one period of the function.
- If the function is negative in some areas, and these area are ignored by the edges of the trapeziums.
Overall the trapezium does provide a good fit to the area under the curve from b-a if the above conditions are met.