value is to the value of 1, the more
confidence we have in (accurate) the goodness of fit is or how well it fits a set of observations. Since the
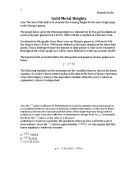
value is approximately
, we can assume that this linear equation is relatively accurate.
a
-1264.6
b
0.7551
r
I chose this function because it shows that a linear regression has an approximation through
that in this function is approzimatley 88% accurate of what the observations display.
Below is the model function and the original graph:
The differences between the model and the original data are that the linear function predicts the new values in the next years through its slope line, while the original graph shows the Winning heights (y-value), but does not project future heights.
This is a linear approximation. In a more accurate graph, the slope should align better with the data. And while this function projects heights in future Olympic games, the function does not perfectly align with the data.
The next task is to find another function that models the data. The other possible function that could be used to model the data is a polynomial model. The higher an order (how high the powers go for each x and decreasing by one for the following x. For example:
Note that the e stated above is meant to represent a constant not the constant of e
Using technology (Microsoft Word>charts) I was able to increase the order until the
was extremely close to 1 in value, therefore the goodness of fit is as good as it could be for a model.
This is the model that occurred after trying to find the best fit. This equation had the closest value to r² out of all the order possibilities.
r²
0.99099
The lower r2 value for the linear regression indicates that the polynomial regression is a better fit to the data.
Here is the graph that shows that the polynomial better is a better fid for the data then the linear model.
Estimating the winning heights of 1940 and 1944 would be done in the following way:
Look at the Polynomial Model since it has a better goodness of fit.
Plug the heights (x-
To get for the heights
To predict the winning height of 1984 and 2016 we would use the same method as the previous two data points to find
The projected winning heights fit with the polynomial curve. More so for 1984, since the known data is continuous into 1984 so the winning height would be more accurate than for 2016. 2016 is less likely to be what actually happened but it is accurate to what the graph says. Since there are no data points from 1984 to 2016, the model is following the data pattern from a set of data from 1932 to 1980, and it is possible that the data could drastically change from, but should not be taken into consideration to heavily since there is an assumption that the data will follow the model.
The following table gives height for all the Olympic Games since 1896 to 2008
r²
0.97663
Since the original polynomial model changed with the additional data, it did not fit the datat well, but with the new data the r² is less than the original polynomial graph which had a r² of r²
0.99099. Still better than the linear graph which had a r²
Here is the data in a table to compare graphs
The trend from 1896 to 2008 is relatively stable slope until 1952 where the slope increases in a (if it was a double derivative) concave down manner until 1996, where it levels off.
Modifications to the data would be to interpolate the data, which is the process one uses to determine a value on the line of best fit within the cluster of scatter plot data.