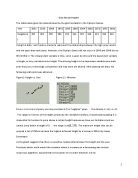
I chose linear function to model it, because the graph shows a general increase on the heights from 1948-1980 so in my opinion the linear will be the best function for it.
After sketching the new model function using the original data using Geogebra. The gradient calculated by the software is represented by :
y= 0.7456x+194.2535
Testing the software linear equation:
y= 0.7456x+194.2535
Let x = 44, we expect y= 225.
y= 0.7456 (44)+ 194.2535
y= 227.0599
There is a bit different from the actual data.
According to software, the R2 = 0.8927, R= 0.94482802668
Subsequently, I decided to test with the Sine equation using Geogebra to find out a better line to fit with the data given.
The software gave the equation of y= 217.9381 + 19.2462 sin (0.054x- 1.758).
And R2 = 0.9361
R= 0.967522609555
Conclusion:
After sketching the linear graph and sine graph to investigate the best-fit model, I can see that the sine model fit the data from 1932- 1980 better than the linear function. The evidence is given by the value of R,
Sine function R =0.967522609555
Linear function R= 0.94482802668
Sine R is closer to the value of 1.
Furthermore, after sketching two functions on the new set of axes, I realize there is limitation in linear function, which, the x value will increase as y value increases. It is clearly impossible in the year, lets say 2050, the athletic will be able to perform a high jump of 5 meter despise gravitational force. On the other hand, the sine curve seems to be more reasonable to predict the jump height in the future. Even though we do not know whether the height increases or decreases but the sine function still keep the data in range of human ability.
Therefore in the next step, I decide to use sine function to predict the height in 1940 and 1944 if had the game been held:
1932-1940 = 8 years
y= 217.9381 + 19.2462 sin (0.054x- 1.758)
x= 8
1932-1944= 12 years
y= 217.9381 + 19.2462 sin (0.054x- 1.758)
x= 12
=> y = 200.7 cm
The answer would be mathematical reasonable increasing if we assume the data follows sine equation. The data are still in human range that the athletic can perform, however it is hard to say that they are 100% correct since we only rely on technology.
I also decided to use the function to predict the result in 1984 and 2016
1932 – 1984 = 52 years
y= 217.9381 + 19.2462 sin (0.054x- 1.758)
y= 234.63 cm
1932- 2016 = 84 years
y= 217.9381 + 19.2462 sin (0.054x- 1.758)
y= 224.8 cm
The answer are mathematical correct. However, in reality we do not know whether the data will truly describe the result since we only the data up to 1980.
Data table from 1896 – 2008:
The graph below represents the data from 1896 to 2008 :
The sine model I used fit even better when I obtain additional data. The value of R= 0.980561063881, which is closer to R=1. However, it only went through some data points.
Different between the actual data and data calculated by using
y= 212.9337 + 24.6777 sin (0.0324x- 1.9601)
After comparing the data between the actual provided height and the new best-fit model when we have addition data, it seems to be likely describing the nature of the data. However, the function does not fit in most of the data. Moreover, a better function should be investigated to make sure it goes through all the data point. However, due to the limit knowledge at the moment when I only know about linear, exponential, sine, logistic functions, it prevents me from going further to develop a more advance function which fit all the data points. Although the two functions have their R-values near to 1, especially sine function, it does not go through all the data point.