Linear Model
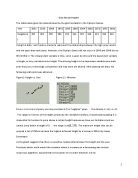
Graph 2: The winning heights of Olympic Games against years since 1932 (between 1932 and 1980)
In order to make calculations easier, I created a graph of height versus years since 1932 as seen in graph 2. When considering the trends and possible functions this graph models, I immediately thought that the function that models the behaviour of this graph is a linear function. This can be shown by the line of best fit in Graph 3 which is linear, where the line goes through point which allows the same number of points to be above and below the line.
Graph 3: The winning heights of Olympic Games against years since 1932 showing linear line of best fit.
The overall trend of this line of best fit is a positive increase. This line of best fit passes through points E (1956) and G (1964), and touches F (1960). A (1932), B (1936), H (1968) and K (1980) are above the graph and C (1948), D (1952), I (1972) and J(1976) are below the graph. This means that there are equal point above and below, however A, B, C, D and K seem to deviate away from the line of best fit by quite a large amount.
By using the coordinates of two points whom this best fit line passes through (E and G), the equation of the line of best fit was found.
m=y1-y2x1-x2
m=218-21232-24
m=68
y-218x-32= 68
y-218=68(x-32)
y-218=68x-24
y=68x+194
y=34x+194
I have graphed this analytically found equation with the line of best fit in order to compare.
Graph 4: The winning heights of Olympic Games against years since 1932 showing best fit line (dashed) with graph of linear function found to model graph (solid).
The equation I analytically found passes through the middle of E(1956) and G(1964), while the line of best fit does not pass directly through the middle, but rather slightly to the left. This means that the y intercept of the line of best fit is larger than my linear function and the gradient of the line of best fit is larger than my linear function. It is a very slight difference which does not affect the model significantly.
When considering the points the graph goes through I thought that the first 2 points, the 1932 and 1936 data didn’t fit with the proposed linear model. The heights achieved for 1932 and 1936 are quite similar to heights achieved in 1948 and 1952. The best possible explanation for this is that between 1940 and 1948 when World War 2 was on athletes lost training with the lack of facilities and time. This stopped the improvement of heights when seem to have begun again post-World War 2. I would therefore like to make the assumption that the lack of progress between 1936 and 1948 was due to the lack of training in the war, and so in 1948 when the games resumed the athletes began their progress once again.
I believed that my model could be refined by disregarding the 1932 and 1936 data. I have produced a graph on Geogebra to model this.
Graph 5: Graph of winning heights (cm) against years since 1932 between 1948 and 1980
This refined model is a much better representation of the data as even though the line does not pass through any points, it touches G (1964) and majority of data points (with the exception of J(1976) are very close to the line. The fact that J(1976) is quite far from the line can be disregarded in this model, as the trend continues as seen with K(1980) being close to the line.
This gives the refined linear function y = 1.02x + 184.67.
However, even after refining my graph there are limitations with using a linear function to model the graph. A linear line increases infinitely, and as humans have restraints as to how high they can jump, for example gravity, their winning height cannot keep increasing at this rate, it is unsustainable.
Natural Logarithm Model
After considering the limitations of my linear graph, I decided it would be unrealistic to apply any model of equation that has an infinitely increasing range (for example quadratic or exponential) because there is only so much the human body can do to overcome gravity. Therefore, the only other possibility is a log graph.
Using Graphical Analysis I attempted to use a natural logarithm to model the data.
Graph 6: Graph of winning heights against years since 1932, showing natural logarithmic relationship.
Unfortunately this natural logarithm didn’t model the data reliably. The line does not pass through any points, and the first 5 (1932 – 1956) and 8th (1968) points are very far from the line, thus showing its bad fit.
The assumption I made about World War 2’s effect on the progression of heights again leads me to think that removing the 1932 and 1936 heights achieved would result in a logarithm fit that would model the progression of heights that would have occurred had the war not happened. This is shown in graph 7.
Graph 7: Graph of winning heights against years since 1932 between 1948 and 1980 showing natural logarithmic relationship.
This modification to the graph allows the natural logarithm to model the data better, as the line passes through the first point (1948) and all other points (1952 – 1980) are close to the line.
Estimating and Predicting
To estimate what the winning heights of 1940 and 1944 would have been, I can use this logarithm model and substitute 1940 and 1944 in the equation found by Graphical Analysis as x to find y:
y = a ×logbx
y = 30.36×log42.54x
For 1940, X = 8 as its 8 years since 1932.
y = 30.36×log42.54x
y = 30.36×log(42.54 ×8)
Y = 76.9 cm
For 1944, X = 12 as its 12 years since 1932.
y = 30.36×log(42.54 ×12)
Y = 82.2 cm
These values seem low in comparison, but this is one of the limitations of the model that the gradient is very steep up until 1932 which is unrealistic.
The winning height in 1984 and 2016 can also be predicted using the logarithm equation y = 69.91×log42.54x , as we are considering data from a wide range. As the ‘progression’ began in 1948, I will predict the wining heights using ‘years after 1948’ as my x variable.
For 1984
1984 – 1948 = 36 = X
y = 69.91×log42.54x
=222.7 cm
For 2016
2016 – 1948 = 68 = X
y = 69.91×log42.54x
=242.0 cm
When comparing the predicted 1984 winning height with the actual height recorded we can see that the predicted is lower than the actual. The actual was 235cm, while my calculated was 222.7cm. This is not a significant amount but is enough to prove that my model is incorrect in predicting the winning heights.
As 2016 has not come yet and we don’t have any recorded data for it, we cannot measure its accuracy but we can measure how probable it is. Looking at the 2008 height of 236, it seems quite probable that 242cm could be achieved as the rate of improvement is decreasing, but the improvement is still increasing.
Considering Additional Data - 1896 - 2008
I will now consider additional data surrounding 1932 to 1980.
Following is a table with the additional points:
Table 2: The winning heights (cm) for Olympic Games in years between 1896 and 2008 (excluding 1932 to 1980 which can be seen in Table 1)
I have used graphical analysis to graph the combined Table 1 and Table 2 data.
Graph 8: Graph of winning heights (cm) against years since 1896 (from 1896 to 2008)
The overall trend from 1896 to 2008 is a gradual, positive increase. However there are some significance fluctuations which cannot be ignored. The earliest is the drop from the 1896 result to the 1908 result. The most likely explanation for this is that 1904 was the beginning of World War I, which could be because of the lack of training and facilities. This idea is seen again at the time of World War 2, where there is a drop from the 1936 to 1948 results. Another notable fluctuation occurs after 1968. After some research into the history of high jumping, I found that this is the year when American athlete Dick Frosbury first introduced the Frosbury Flop technique, breaking the world record. There is a sudden leap in the gold medal winning heights starting from 1980 and onwards which could relate to the mastering of this Frosbury Flop technique.
Considering the logarithmic function used previously to model the 1932 to 1980 data, we can compare how the additional data fits the model.
Graph 9:The winning heights against the year of Olympic Games showing the logarithmic fit for 1948 – 1980, and its extended graph for 1896 to 2008.
Unfortunately the logarithm model does not fit the graph the combined data points. The gradient is very steep and so previous to 1948 the natural logarithm suggests the winning heights would be a lot smaller than they are. the first 8 points are very far away from the line, while the next 11 are close and the next 5 are far away again.
Despite this, my model could be modified to fit the additional data.
The cubic model can model both the upward curve in the years leading toward the world war where the rate of improvement is high, and decreases due to the war and it also models the leveling off during the last years where the rate of improvement lowers.
Cubic Model
Graph 10: Graph of winning height against year of Olympic Games (between 1896 and 2008) showing cubic function.
*The y axis is the winning height and the x axis is the year of Olympic Games.
However the model curves upward before the year 1896 and curves downward after the year 2008 which disagrees with the trends of the data. Therefore we can assume the cubic can only be used for data between 1986 and 2008.
Gaussian Model
Considering this limitation, I sought to find another model which could fit the data and came across the Gaussian model. The Gaussian model begins with a level and horizontal line and then curves up similar to the cubic model. It also models the leveling off as the years approach 2008. But, like the cubic model slopes downwards after the 2008. It is a better representation of the data than the cubic model since it does not slope upwards in the years before 1896. Their winning height would never have begun at 0 because naturally humans can jump a certain height. Thus this level beginning fits well.
Graph 11: Graph of winning height against year of Olympic Games (between 1896 and 2008) showing Gaussian function.
*The y axis is the winning height and the x axis is the year of Olympic Games.
Conclusion
To conclude, it is very hard to find a model which fit exactly the trends of the data from Olympic Games, but this investigation has found that the Gaussian model is the model which models the data most.