We can use the following formula to calculate r2:
Explained Variance
True Variance OR
The closer the value it is to 1.00, the more suitable the line is for the graph. I just used the Excel program to calculate the r2 value for me.
A3. Interpretation
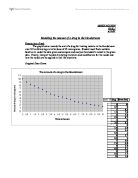
The reasonableness of the data is acceptable for the most part with minor discrepancy. The data is pretty reasonable until it goes beyond 10 or more hours when the amount of drug in blood reaches below 0 with negative numbers which are impossible.
Also, in the data given there is a little minor mistake. Between the 7.5th hr to the 8th hour after the initial dose of drug, the amount in the blood stream remains the same. I thought it might be a human error because I didn’t think the amount of drug would stay the same for that specific hour. It should have a small decrease.
The suitability of this graph is good. The r2 is .9942. The r2 being .9942 allows me assume that the trend line fits very well near actual data points. From just looking at the graph it self, it looks like most of the data points are on the line. This is the most suitable one I saw out of my other line of best fit options. Example, the linear line of best fit didn’t even fit on about half of the data points. Even thought the polynomial trend line graph is not bad, the r2 is not as close as the exponential line of best fit.
Part B
A patient is instructed to take 10 microgram of this drug every six hours.
1. Sketch… over a 24 hour period
Model B
a. I assume that the amount of drug in the slope of the curve after the initial dose would be steeper. I assume that because the starting amount of the drug at 6 hours is different than the amount of drug starting at zero hours. For a person’s body, I think the decay would not be the same rate if the initial amount of drug already in the body is increased. The “rate of decrease of the drug is approximately proportional to the amount remaining.” The more drugs there is to start with, the fraction of the amount before is not going to be the same. If the rate doesn’t change, then the relationship would not be proportional. Therefore, I assume that the slope of the trend line would be steeper.
b. I also assume that there is left over drug in the bloodstream from the previous dose while taking the next dose. The drug is supposed to be taken every 6 hours and according to the given data, there is still drug in the bloodstream after 6 hours. Therefore, the amount of drug left in the bloodstream before the next dose would get a little higher because more drugs is added before all the drug was gone in the bloodstream. I assume that the left over drug would start building up in amounts in the body. Example, after 6 hours, there is 4 microgram of drug left in the bloodstream. After 12 hours there will be 4.3 micrograms left in the bloodstream, and it goes on building up higher. Another reason I assume that is because some medication labels would something like “take this drug for 5 days and if the illness continues, stop taking this drug and see your doctor.” I predict that the manufacturer of the drug do not want the person taking the drug to have excess amount of the drug inside his/ her bloodstream because the patient is continuously taking it.
2. Data points for model B (model B on next page)
Model B
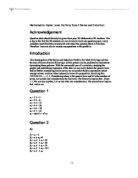
This graph models the amount of drug in bloodstream over a 24hr period of time. On the graph, I can see that the dose is added every six hours and the slope gets slightly steeper every time because of the increasing gap between the first two dots after each new dose. The amount of drug in the bloodstream increases and decreases repeatedly.
Method
I started by entering the data given up to the sixth hour. At the sixth hour, I added 10 to the left over amount of drug in bloodstream. I use the original exponential function to figure out what the amounts should be. I know the y value and the x value. The y value is the left over amount at 6 hours plus 10 for the new dose to figure out the new amount of drug in the bloodstream. All I have to do is change the “10.391”To z and solve for it in a graphing calculator. Afterwards, graph the equation on a graphing calculator. (NOTE: I’m sorry, but I do not have the software to copy the ti-83 screen to the computer so I can’t show pictures of the screen from the ti-83. I try to explain as best as I can with words on the next page))
Step 1: Orginial function: y=10.391e^-.1863x
Step 2: replace x and y with know values and change the 10.391 to z.
X: 6 (because it’s the time in hours that the new dose is going to be taken)
Y: 3.7 +10.0 = 13.7 because it’s left over amount of drug from previous dose plus
10 (new dose) for a total of 13.7 micrograms.
New equation: 13.7= z e^(-.1863*6)
Step 3: solve for z
- -.1863*6=-1.1178; b.)e^-1.1178=.3260; c.)13.7/ .3260=41.896=z
Step 4: graph the old equation replacing the 10.391 with z (41.896) in a graphing calculator.
Y= 41.896e^-.1863x
Step 5: find the new values
Use the table to find the new values up till the next dose at the 12 hour and repeat the same procedure here.
Interpretation
The reasonableness of Model B is logical, for all my assumptions are true according to Model B. The data seems scientifically reasonable. It makes sense and there are no unreasonable amounts in the values. The model did show a steeper slope and an excess buildup of leftover drug. I didn’t add a line of best fit because there wouldn’t be one that would fit all of the data points in a suitable way. If I do each separately, they should be similar to each other.
Approach
3. Maximum and Minimum
Maximum is at the 18th hour at the beginning of the 4th dose of drug with the amount of 14.7349 microgram in the bloodstream. With the excess buildup of leftover drug, the maximum is at the beginning of the last dose taken, in this case of 24 hours, the 18hr would be the last dose.
Minimum is at the 5 and a half hour with the amount of 4 micrograms in bloodstream. With no buildups from previous doses, the amount at the end of the first dose would be the lowest.
4. What would happen to the values during these periods?
(a) No further doses are taken
If no further doses are taken, then according to the model chart, the amount of drug in the bloodstream would continue to decrease until the amount is too small to measure. The model is an exponential decay which means the line will never touches zero, but in this case, I can assume that the drug would eventually be completely gone from the body even though the model shows that the amount would never reach zero. I just assume the line would reach to the amount when it can’t be measured and call it the zero mark.
(b) Doses continue to be taken every 6 hours.
If dose continues, then the graph would continue. The left over amount of drug in the body would continue get higher and higher. Even though it increases and decreases, there is still going to be buildup of drugs. I am assuming that if this person or patient takes too much of this drug, he/ she might get into an overdose situation with all the excess amount of drug. The values in this graph will be completely opposite of the graph in situation a.
Real life situations along with limitations and modification
For this model to accurately represent the model, the process the drug is inserted has to be the same. Example if this malaria drug was injected into the bloodstream by a needle, then any other drug that is going to follow this model must also have the drug be injected into the body the same way for the model to fit the data. Also, for the model to fit the situation the drug must have the same rate of decay and I guess the particles or something that makes up the drug must be similar. If the rate of decay is different because the drug is made from different particles, then the graph would be different.
Everyone’s biological processes in the body are different. Every drug will not have the same effect in everyone. Some, the drug might help them recover fully from this malaria after taking the drug for a week while some people have to continuously taking the drug for months to get the same results.
What if the person was taking another drug along with this current drug? I think that if another drug is taken while this drug is also taken, one drug might cause the other drug to decay faster in the body. The model can not accurately represent what will happen because often, people take drugs without first asking a doctor. A common person would not know what would happen if two different drugs were taken together.
There are too many different factors that needed to be controlled for the model to work, so I do not think this is a very accurate model. Maybe the model is accurate to a certain extent. It should only be an approximate model of amount of drug in the bloodstream. Currently, I can not think of anything to modify this model to make it more accurate.