y=x² : (0,0)
y=(x-2)² : (2,0)
y=(x+3)² : (-3,0)
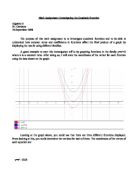
The position of the graph would vary depending on the value of h. This is because h determines where on the x-axis the graph is suppose to be. Therefore, h will affect the graph horizontal-wise. However again, h has nothing to do with the shape of the graph, but only its position on the graph.
All that is different between the three equations are their positions on the graph. As you can see, they are all on the same x-axis, however, they are spread out horizontally. Therefore the transformation used from y=x² to y=(x-h)² is horizontal translation.
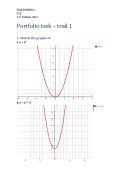
Now without using technology, I would like to sketch a graph y=(x-2) ² + 3 which is from the family y=(x-h)² +k with y=x².
In the equation y=(x-h)² + k, the h represents x-coordinate of the vertex, and the k represents the y-coordinate of the vertex. Therefore if you apply this to the function y=(x-2)²+3, the vertex will be (3,2). If you compare this with the sketched graph, you could see that this information is accurate. The shape of this graph would look exactly the same as a graph with the equation of y=x².
Now using technology, I will graph two functions; y=x² and y=(x-2) ² + 3. By doing so, a comparison between the two families could be observed.
The shape of both graphs is the same since there is no variable included in the equation that could affect it and because they both look identical. However, you could see that the vertices of both equations are different. You could see from the graph that the vertex of the function y=x² is on the origin (0,0) and the vertex of y=(x−2)²+3 is (2,3). Therefore the positions of the two parabolas are different.
In order to understand more about the family and to certify that my comment is correct, I will use another demonstration by using the function y=(x+4) ² -1 first without using the assistance of technology with y=x².
In the equation y=(x-h) ² + k, h represents x-coordinate of the vertex, and the k represents the y-coordinate of the vertex. Therefore the vertex of y=(x+4)²−1is (-4,-1). The shape of this graph would look exactly the same as a graph with the equation of y=x².
Now I will illustrate it using technology.
Again, the shape of the graphed equations are the exactly the same since there is no variable in the equation that will affect its shape. On the other hand, the position of y=(x+4)²−1 is very different from y=x² since the vertex of it is (0,0), and the vertex of y=(x+4)²−1 is (-4,-1).
From these results, you could conclude the following:
- The graph of y=(x-h) ² + k is the same shape as the graph of y=x².
- The graph of y=(x-h) ² + k is a duplicate of the graph of y=x² through (h,k).
Now, I will illustrate another approach by comparing y=x² with a quadratic equation, y=x²-4x+1.
I will do so by graphing them onto the same set of axes.
Like always, the vertex of y=x² is on the origin (0,0). However, the quadratic equation, y=x²-4x+1, has the vertex of (2,-3). They are also drawn as parabolas since a quadratic equation could be expressed as the family y=(x-h) ²+k. Again, the shape of both parabolas is exactly the same.
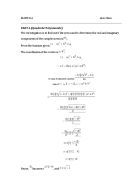
In order to write a quadratic equation into the form of y=(x-h) ² + k, you will need to use the method completing the square.
y=x²-4x+1
y=(x²-4x+4)+ (-4+1)
y=(x-2)²-3
You could also expand the result to verify if it’s correct.
y=(x-2)²-3
y=(x²-4x+4)-3
y=x²-4x+1
From the following sequence, I was able to notice that y=x²-4x+1 is the same as y=(x-2)²-3.
This time, I would like to investigate the family y=ax² where a is the coefficient of the x² term. After the many sets of experiments, I could conclude on how a affects the function. First, I will graph functions with positive coefficients.
From the first look at the graph above, you could infer that the vertex of all three equations is positioned in the exact same place which is the origin. Also the direction of the openings is all facing upwards. But the widths vary since some are narrow or wide. From this, you could conclude that if the coefficient of the x² term is greater that one, the parabola appears narrow, and the greater it becomes, the narrower they become. This is because y=4x² is narrower than y=2x².
Now, I would like to graph the family y=ax² with a coefficient between zero and one.
Again, the position of the two functions and its vertex are the same. Their openings are also facing up which is probably because the coefficient is positive, however I can’t fully conclude yet. However, the width of the two equations is different. Since Equation 2 is less than 1, it appears to have made the rate of the slope increase more. This makes sense since if a=0, the final equation would be y=0 which is a straight horizontal line on the x-axis. So if a is positive and less than 1, it is moving closer to the x-axis.
Then, I made another graph where a (the coefficient) is a negative number to investigate how it affects the graph.
Now, we could see a drastic change compared to the 2 previous graphs. With a negative coefficient, we could now conclude that the opening will always face downwards. Also since a is -2, you could see it is narrower than Equation 1 which is similar with the other graphs. Like always, the vertex of both equations stay at the same position.
For the next graph, I will try to prove that the lower negative coefficient will result Equation 2 into being wider than y=x².
Eventually I was right since Equation 2 ended up being wider than y=x² because the coefficient is less than zero to -1. Again, the Vertex is at the origin (0,0) and Equation 2’s opening is facing downwards.
Through the four previous series of experiments, I was able to understand the significance of a. In the family y=ax² where a is the coefficient of the x² term, the coefficient has nothing in relation with the position of the parabola on the graph. However they contribute in the shape of the graph and the direction in which the graph opens. The lower the coefficient is in positive terms, the wider the parabola becomes. The lower it is in negative terms, the narrower the parabola becomes. Also, if the coefficient is positive, the opening will be facing upward, and if it’s negative, the opening will be facing downward.
Now , I would like to use compare using coefficients on the family y=ax² (y=2x²), and also on the family y=a(x-h) ² + k (y=2(x-1)²+3) where a is the coefficient of the x ² and (x-h) ² , however first without using technology.
After sketching the graph, I could see how coefficients affect the family y=a(x-h) ² + k. In order to obtain coordinates of the vertices for y=a(x-h) ² + k, I put the variables (h,k). Using this method, the vertex will be: y=2(x-1)² + 3 → (1,3). The vertex of the family y=ax² is always at the origin which is also what I learned through this portfolio.
This time I used technology to get an accurate graph.
From the 2 previous graphs, I could that both of the parabolas’ openings are facing upward and have the same wideness since both coefficients are identical. However the position of Equation 2 is different from Equation 1.
Through the long series of experiments made in this portfolio, I was able to comprehend the significance of constant terms and coefficients and how they affect different types of families. Some of those effects are shape, position, and the direction of the openings. Also, I was able to interpret specific functions smoother by the end, and I basically was able to understand more about quadratic functions. I am sure I could imply on what I’ve learned through this assignment to problems in the future.