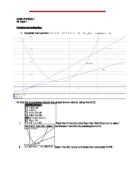
The above table shows that as values of a are increased, the values of D decrease proportionally.
Therefore my conjecture for the value of D for the above parabolas would be:
There are however, some conditions to this conjecture.
- This conjecture only holds for positive values of a.
- The lines intersecting the given parabola should be y = x and y = 2x.
- The vertices of the parabolas should be in the first quadrant.
- The lines, y = x and y=2x should intersect with the given parabola, twice.
3.Now I will look at different values of a [i.e. even negative values of a because so far I have only analyzed positive values of a] and I will also look at placing the vertex in different quadrants.
First I will look at different values for a. I will start by making a = -1
[In green]
[In black ]
[In red]
Now I will look at the value of a = -2 and how that affects the value of D.
[In purple]
[In black]
[In red]
I have observed that the value of D is positive 0.5 even as a becomes -2. Thus according to my initial conjecture I should have got an answer of -0.5 as and the value of a was -2 but I got the answer D = 0.5 which leads be to question by initial conjecture and broaden the scope of my investigation. I see a trend developing that D might be inversely related to the absolute value of a but I will look at a few examples to be sure.
Now I will look at the value of a = -5 and how that affects the value of D.
[In purple]
[In black]
[In red]
This table summarizes the correlation between a and D for different values of a. I can be clearly seen that D is inversely proportional to the absolute value of a [i.e.].
Therefore the conjecture needs to be refined to:
Now I will look to find if changing the quadrant in which the vertex is placed, alters or refines my conjecture. To analyze this I will place the vertex in each of the quadrants.
Vertex in Quadrant 1
I will give 1 example of a parabola which has no solutions[i.e. does not intersect the lines y = x and y = 2x] and another example of a parabola that does intersect the given lines and has a solution.
Example 1.
Functions in the graph:
[In blue]
[In black]
[In pink]
As can be seen from the graph, no intersections between the parabola and y=x or y=2x exist. Therefore there are no real roots or intersections to this parabola and therefore D cannot be calculated.
Example 2
Function seen in the graph:
[In blue]
[In black]
[In pink]
Graphs in the first quadrant have been analyzed before and I will state my observations.
- For graphs in the first quadrant. Placement of the vertex does not affect the conjecture as long as the given parabola intersects the lines y = x and y = 2x, twice.
- Also I found that D is inversely related to the absolute value of a and not to a itself.
Quadrant 2
Example 1
Function seen in the graph:
[In green]
[In black]
[In red]
Again, the parabola of the function does not intersect the lines y = x or y = 2x and therefore has no real roots and a value for D cannot be found.
Now I will look analyze the parabola when in intersects the lines y = x and y =2x with its vertex in quadrant 2.
Example 2
[In blue]
[In black]
[In pink]
Therefore, this results is in accordance with my conjecture that:
I have found that D = 1 with the help of the graph of the function . The value for a is -1 and therefore when a is substituted into the conjecture, then the results is
D= → → → 1
Parabolas with vertices in Quadrant 3.
Example 1
[In red]
[In black]
[In pink]
Example 2
[In red]
[In black]
[In pink]
For examples 1 and 2 here, no solutions or roots can be found because the linear and quadratic function do not intersect and it is therefore impossible to find the roots and therefore D is not defined for these graphs.
Example 3
[In red]
[In black]
[In pink]
When the vertex is in quadrant 3, again the trend continues that
- The placement of the vertex is not important as long as the linear functions intersect the parabola twice each.
Vertices in Quadrant 4.
Example 1
[In blue]
[In black]
[In pink]
Example 2
[In green]
[In black]
[In pink]
This example shows how there are no solutions x1, x2, x3, x4 if the parabola does not intersect the given lines, y = x and y = 2x.
Therefore, through analysis of the above examples I have found that it does not matter, where the vertex is placed or what the value of a is,
Even this conjecture has some restrictions though, these conditions are that:
- The lines intersecting the function must be y = x and y = 2x.
- The lines should intersect the parabola in 2 places each.
Proof showing that the conjecture[ ] is true.
Even though this conjecture has been proven, still there are some limitations
- The lines intersecting the function must be y = x and y = 2x.
- The lines should intersect the parabola in 2 places each.
4.My conjecture has been proven to be true but one of the conditions that was held constant was that the lines intersecting had to be y = x and y = 2x. Now I will investigate to see if my conjecture holds if the intersecting lines are changed[i.e. changing their slope and y-intercept]
Graph showing the equations:
[In black]
[In red ]
[In blue]
Example 2
Graph showing the equations:
[In black]
[In brown]
+2[In blue]
Another pattern seems to be emerging here, as seen in examples 1 and 2 of changing the intersecting lines. The conjecture made earlier is violated and a new conjecture can be made because D seems to be related to the slope of one intersecting line subtracted from the slope of the other intersecting line all over the absolute value of a.
Example 3
[In red]
[In purple]
In green]
From this example I can see that D would equal the absolute value of the different of the slopes of the intersecting lines divided by the absolute value of a rather than only the difference of the slopes over the absolute value of a.
Some general conclusion that can be drawn from the analysis of changing the slopes of lines.
- A change in the y-intercept of the intersecting lines has no affect on the conjecture
- Changing the slope of the lines
Therefore I have tested lines with different slopes and different y-intercepts and as long as the lines intersect the parabola at 2 points each, the value of where m and n are the slopes of the intersecting lines.
Now I will look to prove my new conjecture of
- Even to this proven conjecture , this is the condition that the given parabola must be intersected by each of the linear functions twice.
5. Now I will see if a similar conjecture can be made for cubic polynomials.
First I will look at a few examples to see if a pattern can be found but first it is important to redefine or rather, refine the equation of D because previously, there were 4 intersections because the graph was a quadratic function but in this case, there is a cubic function. Thus there will be 6 intersections between the cubic function and the 2 linear functions and D will be defined as.
Where x2, x3 and x5 are intersections of one linear function and the cubic function and x1, x4 and x6 are intersections of another linear function and the cubic function.
Now that I have defined the new equation for D, I will look at a few examples.
Example 1
Functions in graph:
y = 1[x-2][x-1][x+1] [in pink]
y= x[ in black]
y=2x[in red]
This is not in keeping with my conjecture that therefore I will look at other examples to see if I can come up with a new conjecture.
Example 2
y = x3 +2x2 -4x -4 [in green]
y= x[ in black]
y=2x[in red]
Again the value of D is found to be zero. I will look at another example before making my conjecture.
Example 3.
y = x3 +2x2 -4x -4 [in green]
y= 0.5x [ in black]
y=2.5x [in blue]
I have found in all 3 examples that D=0 and this is in fact my conjecture.
Although I cannot formally prove this, I will try to justify this.
From Vieta’s theorem we know that:
The sum of the roots of a cubic function =
Where a and b are coefficients from .
x1+x2+ x3 = where x1 ,x2, x3 are roots of the function
Where x2, x3 and x5 are intersections of one linear function and the cubic function and x1, x4 and x6 are intersections of another linear function and the cubic function.
Therefore the sum of the roots of the intersection of the first linear function and the cubic function would be x2+x3+x5=
And the sum of the roots of the intersection of the first linear function and the cubic function would be x1+x4+x6=
Also we know that the slope and y-intercept of the intersecting lines does not affect the sum of the roots because:
The sum of the roots of this function is and therefore any linear function cannot affect the value of the sum of the roots [i.e.] because the coeffecients of the x3 and the x2 are unaffected for any linear function.
Therefore D = 0 is my conjecture and there is a condition to this conjecture.
- The linear functions still need to intersect the given cubic function 3 times each, even though their slope and y-intercept have no effect on the conjecture.
6. I will look at a few examples to determine if the conjecture D=0 holds even for higher order polynomials.
Example 1
y = [x-2][x-1][x+3][x+1][in pink]
y= 0.5x [ in black]
y=2.5x [in blue]
Where x2, x3, x5 and x7 are intersections of one linear function and the quartic function and x1, x4, x6 and x8 are intersections of another linear function and the quartic function.
D = 0
An easier way to this would be to find the sum of the roots of the first line intersecting the quartic and then subtract that from the sum of the roots of the second line intersecting the quartic.
Where Sn is the sum of the roots of the first linear function intersecting the quartic function and Sm is the sum of the roots of the second linear function intersecting the quartic function.
I will look at another higher order polynomial to see if they support the conjecture that D=0.
Example 2
Functions in graph:
y = [x-2][x-1][x+3][x+1][x-4][in red]
y = 0.5x[in black]
y = 2.5x[in blue]
D = 0
Again D = 0 and therefore the conjecture holds even for higher order polynomials. This happens because the sum of the roots is always where a and b are the coefficients of the xn and xn-1 terms of the polynomial respectively.
D =
Where Sn is the sum of the roots of the first linear function intersecting the quartic function and Sm is the sum of the roots of the second linear function intersecting the quartic function.
D =
D =
Therefore D = 0 for all other higher order polynomials!
Bibliography
"Viète's formulas -." Wikipedia, the free encyclopedia. 16 Mar. 2009 http://en.wikipedia.org/wiki/Vi%C3%A8te%27s_formulas>.
"Vieta's Formulas -- from Wolfram MathWorld." Wolfram MathWorld: The Web's Most Extensive Mathematics Resource. 16 Mar. 2009 <http://mathworld.wolfram.com/VietasFormulas.html>.
"Math Forum - Ask Dr. Math." The Math Forum @ Drexel University. 16 Mar. 2009 <http://www.mathforum.org/library/drmath/view/61024.html>.
"Viète's formulas -." Wikipedia, the free encyclopedia. 16 Mar. 2009 http://en.wikipedia.org/wiki/Vi%C3%A8te%27s_formulas>.