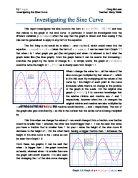
Moving on, we now set and at 0 giving the equation the form of . It is observed that changing the has the same effect as changing the in the equation, except rather than the curve stretching vertically it stretches horizontally. This is known as a period in mathematics. It is the interval between likewise values, or in simpler terms the interval before the graph ‘repeats’ itself. The graph below shows the curve stretching inwards or outwards (depending on whether the value is greater than or smaller than 1) without changing the vertical position of the curve.
The reason that this horizontal stretch occurs is because all the values of the curve are multiplied by a factor of . This means that a lower value of is required to get the same value as the original graph. An example of this can be seen when in the original graph, (as can be seen from Graph 2.1). However it can be seen that when is 2, a lower value of is required to get . When the value of would need to be so that . This tells us that all the values of would be half of what they were originally causing the curve to become narrower and therefore decreasing the period of the curve. On the other hand, when the value of is smaller than 1 a bigger value of would be required to get the same value of . For example, if you need the graph to give you the same value as the graph of when is then the value of would need to be in the curve.
As it has already been mentioned, by changing the of the equation you either stretch the graph inwards or outwards (depending if the value of is bigger or smaller than 1). When you increase the value of you decrease the period of the graph and when is decreased the period of the graph increases. However, what happens if the value of is a negative number? When the value of is negative it has the same effect as when is negative. This is because is the same as . This means that a negative value would flip the graph with respect to the - axis as shown in Graph 2.2.
In general it is observed that in the equation the period of the curve is given by . By changing the value of you can change the period of the graph. When you increase the the period of the graph decreases and when you decrease the the period of the graph increases. This means that the curve only stretches in the horizontal direction while there is no stretch in the vertical direction of the curve.
When you make and 0 you get the equation . In this equation, corresponds to the horizontal translation of the graph. When is a positive number the translation is a horizontal translation to the right, whereas when the value of is negative the graph translates to the left by units as illustrated by Graph 3.1.
When you change the value of you subtract the original value of by , and therefore the value of the new curve would be increased by to match the value. For example, when , where is 0, . However when there is a value for , cannot be 0 unless in which case must be equal to . This would translate the point and the rest of the graph by units to the right. This would only cause a translation meaning that there is no change in the amplitude or the period of the curve. From Graph 3.1, it can also be seen that that when is a negative number, the equation becomes and this causes the graph to translate units to the left.
From Graph 3.2 it can be seen that the value of can be any number. It can either be a fraction, a whole number or even an irrational number. The same concept follows for fractions and irrational numbers as well, where the value of dictates the horizontal translation of the curve.
Overall, it is observed from this graph and the above graph that the in the equation corresponds to the horizontal position of the sine graph. When you change the value of the sine graph would be horizontally translated to the right by units if the value of is positive and likewise to the left when the value of is negative.
Now we will set and 0 so that we obtain the equation . Changing the value of has a similar affect as changing the value of , however the difference is that instead of there being a horizontal translation there is a vertical translation. Graph 4.1 is used to describe this translation, and it is seen from that graph that when is positive there is a vertical shift upwards in the sine curve and when the value of is negative the sine curve shits down vertically.
The value of is the value that the values are added by. Therefore, by changing the value of to a positive value you ensure that the graph will be translated upwards by units as the value is added to the original value. An example of this is that in the original graph , when , the value of is 0. However if you add a value of to the equation so that it now looks like: then the new value of would be different. Let the value of be 2 in the new curve when and your new value of would be rather than 0 and therefore translating the graph upwards.
On the other hand, when the value of is a negative number the graph shifts downwards. An example of this can be seen from Graph 4.1. In the equation , if was and was then value would be rather than 0. For this to happen the curve must shift downwards and therefore a negative value of means that the sine curve shifts down vertically.
In general it can be said that the value of corresponds to the vertical position of the sine curve. This means that if you change the in the equation then you can translate the curve in a vertical direction by units.
All in all we can talk about how the different variables of the equation effect the sine curve and what they all represent. The first thing that we found out was that the variable represents the amplitude of the graph meaning the height of the graph. The amplitude of the graph would be the value of . On the other hand, the value of corresponds to the period of the curve where the period is given by . Moving on, we saw that the variables and correspond to the horizontal and vertical translation of the sine curve respectively. The curve is translated to the right horizontally and units vertically upwards from the original sine curve.
Since we know the general rule of the variables, it can help predict what the graphs would look like, and how they would have been translated from the original curve. This can be done by just identifying the different variables and . We will predict the graphs of , and and then we will test our predictions by graphing these equations.
First of all we examine the equation and identify the different variables. In this equation and . This means that the amplitude of the graph would be , causing the original curve to be stretched inwards, whereas the period of the new curve would be . Since the value of is 0, there would be no translation in the horizontal direction, however the curve would be translated upwards in the vertical direction by 1 unit. On the other hand, the second equation would be look different from the first equation. In this equation the variables are as following, and . This means that the amplitude of this graph would be 3, an outwards stretch from the original graph. The negative means that the graph would be flipped over with respect to the - axis. Since the is 0 there would be change in the period of the graph, whereas the graph would be translated by units to the right horizontally with no change in the vertical position of the graph since . We can now examine the last equation . In this equation the variables look as following: and . This means that the amplitude of this new graph would be 4, causing an outwards stretch of the original graph. Since the period of the graph would be reduced to . Since the graph would be translated units to the left horizontally whereas the curve would shift downwards vertically by units.
The graphs below indicate that the predications that were made about the translation of the graphs hold true, and therefore this means that the conclusions we had come up with about the variables were indeed correct.
So far in this investigation it has been observed that if we are given an equation which is in the form we can predict the shape and position of the sine graph. However what if the equation is not in that form as happens a lot of times? If the equation is not written in the form as written above then it can be transformed to that form as has been done with three examples below. The three equations that would be transformed are: , and lastly the graph .
If we look at the first equation, then the first thing to do in that equation would be to split the fractions so that the equation now looks like: . Once that has been done we can now factorize the brackets’ section by , and therefore the equation would look like: . This final step would now be to factorize the entire equation by 3 so that the equation looks like: . Now that this equation is in the form that we require it to be, we can see the difference variables and see how the sine curve has been transformed. In this graph , , and . This would suggest that the graph as an amplitude of 2, causing the graph to stretch outwards by 2 units. The period would be making the period be . This and value tells us that graph has been translated horizontally by units to the right whereas it has been translated units vertically upwards.
We can use a similar method for the rest of the equations:
From this it can be seen that , and . This would mean that the amplitude of the graph would be , causing the original graph to be stretched inwards by units. Not only this, by the period of the new graph would be and there would be a horizontal translation in the graph of units to the right hand side while there is no translation in the vertical translation of the graph.
Lastly we will look at transforming the last equation into the desired form. The first step, and only step to transform the equation is to factorize by , as this would change the equation to: . Now it can be seen that the value of and lastly, . This means that the new curve would be flipped over with respect to the - axis, however there will be no change in the amplitude. The period of the curve would be given by . And finally it is observed the graph translates 1 unit horizontally to the right whereas the graph translates upwards vertically.
From all the graphs, discussions and examples it is clearly seen that when the sine curve is written in the form we can get a lot about the graph. The represents the amplitude of the curve, the period of the graph is written by whereas the values of and translate the graph horizontally and vertically respectively.
So far in this investigation we have been gathering the shape and look of the graph from just the equation, however we will now do it the other way around. We will find the equation of the curve from the graph.
The graph on the right hand side shows the sine curve and the cosine curve together. It can be observed that the curve of looks just like the curve of and therefore could be a translation. Just like the sine curve, the amplitude () of the cosine curve is 1, whereas, the period () of the cosine curve is (just like sine curve), meaning that the value of the cosine curve would be 1. The only difference in the sine and cosine curve seems to be that the cosine curve has been translated to the left hand side by units, meaning that the value of and the value of . When we plug the numbers into the equation of the sine curve the equation that we get is the following: . Since this equation is for the cosine curve we can say that . However, there is another way to express this translation. It can be said that the graph of was flipped with respect to the axis and then translated horizontally to the right by units. When this is the case becomes, and remain 0 and changes from to . The equation for this new translation would look like and is something else which could be used for calculations in trigonometry.
In conclusion, it was observed that there is a strong relationship between the variables of an equation and how the graph looks. In terms of the sine curve, the variables represent the amplitude, the period and the translations (horizontal and vertical) of the curve. This allowed us to come up with a graph without having to plot it, and when we plotted the graph our guess was shown to be correct indicating that the idea of the variables was correct. Near the end of the investigation, we used these variables and the sine curve to come up with a relationship between the sine and cosine curve which would then help us in future trigonometry calculations. Just like that, we can deduce different relationships between different sorts of sine, and cosine functions to help us in future calculations.
Greg McLean