By making the previous observation, more information can be concluded, however, in order to do so a suitable formula or function need to be found, this can be done by finding the exponential regression which is used to produce an exponential curve that best fits the given data. An exponential curve is usually shown by f(x)=abx. To find the exponential regression a graphing calculator was used and the following was found:
a≈ 10.477
b≈ 0.829
To convert this into a proper logarithmic function, the base (b) of the exponent will be converted into a base (e) which is an irrational constant almost equal to (2.718) and it represents the natural logarithm (ln) which is a logarithm with base (e). To convert base b into base (e) the following calculations are done:
ec = b1
ec ≈ (0.829)1
c = ln(0.829)
c ≈ -0.2
Therefore, b ≈ e-0.2
And so, f(t) = 10.477e-0.2t where (t) is the time taken for the amount of drug to change in the bloodstream.
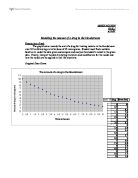
The function previously found will help in making a model to predict the change in the amount of drug in the bloodstream over long periods of time without having to expose the patients directly to the drug just in case something might go wrong. The following graph (figure 2) shows the difference between the function for the model and the data plotted in (figure 1) along with its curve-fit to raise the aware of the fact that a model does not 100% apply in real life.
As shown in (figure 2), the function is accurate enough to be used in making predictions as the curve is close enough to the plotted points and it also crosses the curve-fit at some points as well. For a clearer vision, the following table shows the approximate points given by the graph of the function along with the points given by measuring the drug:
The function has proved to be accurate enough to make further assumptions. A patient is now instructed to take another 10μg of the same drug every 6 hours, therefore, once the patient takes 10μg, the amount of the drug in the bloodstream will immediately rise by 10μg so if the patient is observed for a day (24 hours) the amount of drug in the bloodstream should rise by 10μg after 6, 12, 18, and 24 hours from the initial does and if the function f(t) = 10.477e-0.2t was used to help coming up with a suitable model, the model then should look like the following graph (figure 3):
In (figure 3), It can be seen that once a new does was taken, the amount of the drug in the bloodstream immediately rises by 10μg. However, every time a new does is taken the maximum amount it reaches is higher than that it reached the time before; this means that the drug was not given enough time to completely breakdown, this can be seen in the last six hours of the 24-hours period as it is higher than the other parts giving a maximum amount of approximately 14.8μg at the 18th hour, this amount starts to breakdown after being the highest due to having a higher amount of unbroken drug than the other observations along with the 10μg does that must be taken. Also as the final amount after six hours, right before the next does is to be taken, reaches a higher level each time. This can be seen when looking at the part of the graph representing the first six hours as it reaches the lowest level among all the other times giving a minimum amount of approximately 3.2μg at the 6th hour, this is the amount of drug left in the patient’s blood right before taking the next does. This might create a problem; if the drug was taken every six hours for more than one day it might not have enough time to breakdown and therefore build up in the patient’s bloodstream and might cause a certain problems for being in higher amounts than it should be. Still, if no more doses are taken it will eventually breakdown leaving the patient without medication, this can be seen in (figure 4) where the complete breakdown of the drug can be seen after making a model of the function to cover a whole week.
It can be seen that the drug will completely breakdown after less than 3 days. However, according to the model in (figure 5) below, if the patient continued to take the drug every six hours for a week, the amount of drug will always reach the same maximum amount of 15.0μg and a minimum amount of 4.5μg after a period of 60 hours, this concludes that the rate of decrease of the drug is almost proportional to the amount remaining.
Using a math application in such a case is greatly useful and helpful in order not to make errors in real life for if a patient, such as in the previous case, was given a wrong does of medication it might cost them their life. This indicates that there are always practical uses for mathematics in life as well as protective ones.