Graph 3: y = 3x2 – 3x + 1
Graph 4: y = 4x2 – 10x +7
Graph 5: y = 5x2 – 8x + 3.5
Graph 6: 6x2 – 12x +6.5
Graph 7: 7x2 – 8x + 2.5
Graph 8: y = 8x2 – 10x + 3.5
Graph 9: y = 9x2 – 12x + 4
Graph 10: 10x2 – 12x +4
Graph 11: 50x2 -20x + 2
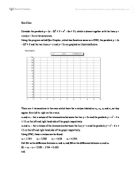
Table 1: Data from graphs 2 – 10 including value for D
From table 1 it is apparent there is a direct relationship between the value for ‘a’ and the value for d. It is evident that they are inversely proportional i.e. if ‘a’ goes up d goes down. From the data a conjecture can be made. The conjecture is D = I a-1 I. Therefore if ‘a’ is 5 then D is 0.2, this is supported in table 1.
-
Investigate your conjecture for any real value of a and any placement of the vertex. Refine your conjecture as necessary, and prove it. Maintain the labelling convention in parts 1 and 2 by having the intersections of the first line to be x2 and x3 and the intersections with the second line to be x1 and x4.
Graph 12 below of y = -5x2 - 4x + 1 has a vertex in the 3rd quadrant, according to the conjecture the value for D should be 0.2 and indeed this is true for Graph 12.
Graph 12: -5x2 – 4x + 1
Graph 13: -3x2 – 3x + 1
Graph 13 also proves the conjecture for a vertex in quadrant 2. The D value in graph 13 should be 3-1 and it is. Finally Graph 14 represents a graph in quadrant four.
Graph 14: 4x2 – 8x + 1
The above three graphs all prove that D = I a-1 I is correct as long as the intersections for y = x are x2 and x3 and the intersections with y = 2x are x1 and x4.
- Does your conjecture hold if the intersecting lines are changed? Modify your conjecture if necessary then prove it.
The conjecture does not work for different intersecting lines therefore another conjecture must be made to accommodate different lines. Graph 15 below has intersecting lines of y = 2x and y = 1.5x.
Graph 15: y = -x2 -2x +5
The D value for graph 15 is 0.5 not one as expected, therefore a new conjecture must be made. Through making different graphs with different lines there is an obvious correlation between the difference in the values for the intersecting lines and the D value. In Graph 15 the difference between the two values for the intersecting lines is 0.5, not one as in all the other examples. If the difference is multiplied by the inverse of a the new value for D can be found, this was not needed in the other questions as the difference in the intersecting lines was one and multiplying by one is not needed. The new conjecture for D is:
D = (y2 – y1) (I a-1 I). The graph below proves this conjecture.
Graph 16: y = 0.5x, y = 0.2x and y = x2 + 4x + 6
Using the above conjecture it would be expected that the value for D for Graph 16 is (0.5 – 0.2) (1-1) = 0.3 which is correct. Therefore the conjecture for graphs with different intersecting lines is
D = (y2 – y1) (I a-1 I) or D = Iy2 – y1 I
a
This can be proven algebraically
If y = ax2 + bx + c, y = y1x and y = y2x
D = I SL - SR I
D = I (x2 – x1) – (x4 – x3) I
D = I (x2 + x3) – (x4 + x1) I
x2 and x3 are the intersections between y = y2x and y = ax2 + bx + c
x1 and x4 are the intersections between y = y1x and y = ax2 + bx + c
By substituting into the above equations it can be found that
y = ax2 + (b – y2)x + c and y = ax2 + (b – y1)x + c
x1 and x4 are the roots of the equation which means x1 + x4 is equal to the sum of the roots which is defined by the equation –b
a
By substituting into the formula for D we can see that
D = I (x2 + x3) – (x4 + x1) I
D = I (b – y1) – (b – y2) I
a a
D = I (b – y1 – b + y2 I
a a
D = I y2 – y1 I
a
This is proof for the above conjecture.
-
Determine whether a conjecture can be made for cubic polynomials.
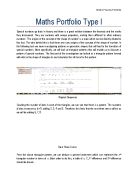
To determine whether a conjecture can be made for cubic polynomials in the form ax3 + bx2 + cx + d there must be a system made for naming the intersections and how D is calculated with these values. Graph 17 gives an example of what a cubic polynomial would look like intersecting each line three times.
Graph 17: y = 0.2x, y= x, y = 2x3 – 5x2 + x + 1
If the conjecture for quadratics was correct the value for D for the above graph would be 0.4. This is not true and the conjecture for quadratics is untrue. The intersections must be named differently to get a value for D. The new formula to find D is:
D = I (x2 – x1) – (x4 – x3) – (x6 – x5) I
Where the points of intersection for the line with a higher gradient are labelled x1, x3 and x6 from left to right and for the other line is x2, x4 and x5. The values SL is still x2 – x1, but the two others are different. SM is equal to x4 – x3 and SR is x6 – x5 . With this definition the value for D is equal to:
D = I SL – SM – SR I
Using graph 17 the following table was made calculating the value for D.
Through various trials with other cubic polynomials the same value for D being 0 was found. Therefore a new conjecture can be made that D = 0 a≠ 0.
-
Consider whether the conjecture might be modified to include higher order polynomials.
The general equation for a polynomial is:
f(x) = anxn + an-1xn-1 + … + a2x2 + a1x + a0
It can also be written as:
f(x) = axn + bxn-1 + … + qx + k
Using the equation the roots will be q1, q2, …. qn
The sum of the roots as stated above is –b
a
When a polynomial intersects with another polynomial of order xn-1 i.e.
y1 = c1xn-1 + d1xn-2 + … + m1x1 + k1 and y2 = c2xn-1 + d2xn-2 + … + m2x1 + k2 the sum of the roots will always be – b – y1 and – b – y2
a a
The two roots will be the
Therefore D will be equal to:
D = I(Sum of roots in y1) – (sum of roots in y2) I
D = I( - b – y1) – (- b – y2) I
a a
D = I- b – y1 + b + y2 I
a
D = y2 – y1
a
That is the conjecture for intersecting lines one degree lower than the polynomial, this is the same conjecture as question two, because question two fit the criteria. If the intersecting lines are more than one order apart a different conjecture must be used which is stated in question five. The conjecture is:
D = 0
Absolute value symbols are not needed as zero is the same whether they are there or not.
Conclusion
There is a definite relationship between the intersecting lines and the parabola. This was found through using quadratic equations and visual aids of graphs to show how a value for D was found throughout the investigation. Through the use of proof to justify each answer it could be used as a way to check each answer and each answer could be used to check the proof, using this method increased the likelihood of the conjectures being correct.