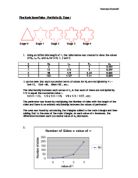
There is a gradual increase in area (An) with progression of n.
Q.3) For each of the graphs above, develop a statement in term of n that generalizes the statement shown in its graph. Explain how you arrived at your generalizations. Verify that that your generalizations apply consistently to the sets of values produced in the table.
ANS 3)
GEOMETRIC PROGRESSION OF SIDES:
When we take a look at the progression of sides with increase in stages, it is evident that there is a geometric progression seen. I arrived at this conclusion because of the following observation:
U0=3
U1=12
U2=48
U3=192
12/3=48/12=192/48=4:1
This follows the geometric pattern of ideas in the formula:
Un=U1*rn
Where,
Un= the nth term,
U1= the 1st term,
R= the common ratio,
n= the stage of the snowflake under discussion
As earlier discussed the common ratio for side is 4:1.
To verify the formula,
U0=3*40
=3
U1=3*4
=12
U2=3*42
=48
U3=3*43
=192
Thus the question of geometric progression of sides is verified.
GEOMETRIC PROGRESSION OF LENGTH:
The progression of length of the Koch snowflake decreases in a geometric pattern as well. This is seen when the sides decrease in a geometric sequence. Let me demonstrate.
U0=1
U1=0.333333
U2=0.111111
U3=0.037037037
0.33333333/1=0.111111111/0.333333333=0.037037037/0.11111111=0.33333333:1
Hence there is a geometric pattern seen. The above observation helped me arrive at this conclusion.
Un=U1*rn
Where,
Un= the nth term,
U1= the 1st term,
R= the common ratio,
n= the stage of the snowflake under discussion
To verify my idea,
U0=1*0.33333330
=1
U1=1*0.3333333
=0.333333
U2=1*0.3333332
=0.1111111
U3=1*0.3333333
=0.037037037
GEOMETRIC PROGRESSION OF PERIMETER
The perimeter of the Koch snowflake follows the laws of geometric progression as well. This is seen due to the observation below:
4/3=5.33333333/4=7.111111111/5.333333333=1.33333333333:1
There is a common ratio seen. This confirms that the progression is geometric. To further elucidate my point I shall provide the general formula for geometric progression and verify it as well.
Un=U1*rn
Where,
Un= the nth term,
U1= the 1st term,
R= the common ratio,
n= the stage of the snowflake under discussion
The common ratio is seen to be 1.333333:1.
U0=3*1.3333330
=3
U1=3*1.333333
=4
U2=3*1.3333332
=5.333333
U3=3*1.3333333
=7.111111
This verifies my above comment and prediction.
GEOMETRIC PROGRESSION OF AREA
The Koch snowflake begins with an equilateral triangle. The area of an equilateral triangle is given below:
(√3/4)*side2
However as new fractals appear, it becomes necessary to add the area of the previous shape along with the areas of the smaller triangles that have cropped up on the sides.
To show how this happens, let me find out the areas first:
At Stage 0,
Area= (√3/4)*12 (Since 1 is the initial side)
=0.433013
Now the area if the 2nd shape is a problem. But if we look carefully, it still retains its old area but has three smaller equilateral triangles on the sides that have sprung up. All these equilateral triangles are similar in size. They are congruent. So if we take the area of the previous triangle and just add the areas of the three new smaller triangles that have cropped up on the side, we have our new area of the 2nd shape.
At Stage 1,
Area= (√3/4)*side2*number of new triangles + area of old triangle.
= (√3/4)*0.3333332*3+0.433013
= 0.577350
We can use the same idea for the area of the 2nd stage as well.
At Stage 2,
Area= (√3/4)*side2*number of new triangles + area of triangle of Stage 1
= (√3/4)*0.1111112*12+0.577350
= 0.641500
It is similar for stage 3 as well.
At Stage 3,
Area= (√3/4)*side2*number of new triangles + area of triangle of Stage 2
= (√3/4)*0.0370370372*48+0.641500
= 0.670011
The area of the Koch snowflake is a slightly complex matter. However, there is evidence of geometric progression. This is seen from the observation below:
0.577350/0.433013=0.641500/0.577350=0.670011/0.641500=1.333331794:1
Hence 1.333331794:1 is the common ratio. Hence we can assume that the area of the Koch snowflake increases with the general geometric progression formula=
Un=U1*rn
Where,
Un= the nth term,
U1= the 1st term,
R= the common ratio,
n= the stage of the snowflake under discussion
To elucidate my point, we shall investigate:
U0=0.433013*1.3333317940
=0.433013
U1=0.433013*1.333331794
=0.577350
U2=0.433013*1.3333317942
=0.641500
U3=0.433013*1.3333317943
=0.670011
Q.4) Investigate what happens at n= 4. Use your conjectures from step 3 to obtain values for N4, L4, P4, and A4. Now draw a large diagram of one side (that is one side of the original triangle that has been transformed) of the fractal at stage 4 and clearly verify your predictions.
ANS 4)
At stage 4,
Number of sides (N4) = 768
Length (Ln) = 0.012346
Perimeter (P4) = 9.4815
Area (An) = 0.682683
At stage 4,
The side of the triangle will increase to 192*4=768. This can be seen by using the formula Un=U1*rn.
N4=3*44
=768.
The length of the side will decrease further. It will become 1/81 of the initial size.
This can also be verified by the formula Un=U1*rn.
L4=1*0.3333334
=0.012346
The perimeter will definitely increase. It will become 12.64198. This can be verified using the formula Un=U1*rn.
P4=3*1.3333334
=9.4815
The area is also going to increase. It will become 1.3685. This can be verified using the formula:
Area= (√3/4)*side2*number of new triangles + area of triangle at Stage 3
A4= (√3/4)*0.0123462*192 + 0.670011
= 0.682683
Q.5) Using the relationship between successive terms of Nn, Ln, Pn and An use a spreadsheet or a similar software to find the values of each up to a value of n where An+1 equals An to six decimal places. What is the value of n at this point?
ANS 5)
In this question I used the area formula which I had applied before.
This can be shown again.
AREA FORMULA:
30.5/4*side2*number of new smaller triangles + area of triangle of previous stage
Nn, Ln, and Pn were found using the simple formula: Un=U1*rn
At n=16 and n=17, the areas of the figures are similar up to 6 decimal places.
Beyond 6 decimal places however there is a slight variation. At n=16 the area actually is 0.692818786 which is different from the area in n=17, which is 0.69281912.
Q.6) Explain what happens to the perimeter and the area as n gets very large. What conclusion can you make as area gets closer to n → ∞? Comment on your result.
To explain the answer, I have prepared a table.
It is seen that with increasing number of stages the perimeter keeps on increasing. At stage 30, it assumes a perimeter of 16799. I assume that as n tends to ∞, the perimeter keeps on increasing and assumes a massive proportion.
However, it increase in stages, the area seems to increase but as the stages progress the area of one stage becomes surprisingly close in magnitude to the area of its previous stage. We assume that the new triangles that form at each stage are getting smaller and smaller such that even though there are a lot of new triangles cropping up at each stage, their combined area is becoming more and more negligible and hence area of subsequent stages becomes a lot similar as n tends to ∞.
This is seen at n=29 and n=30 where the areas are the same at 0.692819388 and 0.692819388 respectively.
The following graphs give us a visual understanding of the behaviour of the perimeter and areas of very large “n”.
For perimeter:
]
For area the following graph is given:
Q.7) Using your general expression for An and the iterative relationship between An+1 and An already established in step 1 above, prove the general expression for An by induction.
ANS 7)
My formula till now for area has been:
AREA FORMULA:
30.5/4*side2*number of new smaller triangles + area of triangle of previous stage
I have to transform my formula into mathematical language. For this, I need to replace a few components in my formula with mathematical symbols.
In my formula, I will have to replace “side2”. This can be done easily. Side2 is represented by “Ln2”. So now I have:
AREA FORMULA:
30.5/4*Ln2*number of new smaller triangles + area of triangle of previous stage
Now I have to replace the expression “area of triangle of previous stage” in my formula. This can be done by replacing it with “An-1”. So now I have:
AREA FORMULA:
30.5/4*Ln2*number of new smaller triangles + An-1
The last part is a little tricky. How do I replace “number of new smaller triangles” in my formula? With a little observation, I have come to realize an important correlation.
The number of new triangles formed at each stage is equal to the number of sides of the previous stage.
For example, at Stage 1, the numbers of new triangles formed are 3 which coincide with the number of sides in Stage 0 which is 3 as well.
Similarly at Stage 3, the numbers of new triangles formed are 48 which coincide with the number of sides in Stage 2 which is 3 as well.
And so on.
This helps me replace the expression “number of new smaller triangles” with “Nn-1”.
Now I have:
AREA FORMULA:
An=30.5/4*Ln2*Nn-1 + An-1
We can generalize the formula to a greater extent. We can substitute Ln and Nn-1 and rewrite the formula as:
An=30.5/4*{1*(1/3)n}2*{3*4(n-1)} + An-1
OR
An= An-1 + 30.5/4*{1*(1/3)n}2*{3*4(n-1)}
This is because length gets multiplied by {1*(1/3)n}2 times and number of new truiangles increases by *{3*4(n-1)} times.
A0 + A1 + A2 + A3+…..+An= An-1 + 30.5/4*{1*(1/3)n}2*{3*4(n-1)}
0.433012702 + 0.577349981 + 0.641499754 + 0.670010707 +……+An= An-1 + 30.5/4*{1*(1/3)n}2*{3*4(n-1)}
For n=0,
A0= A0-1 + 30.5/4*{1*(1/3)0}2*{3*4(0-1)}
As A0-1 and {3*4(0-1)} does not exist
A0= 30.5/4*{1*(1/3)0}2
= 0.433012702
For n=1,
A1= A1-1 + 30.5/4*{1*(1/3)1}2*{3*4(1-1)}
= (√3/4)*0.3333332*3+0.433013
= 0.577350
For n=2,
A2= A2-1 + 30.5/4*{1*(1/3)2}2*{3*4(2-1)}
= (√3/4)*0.1111112*12+0.577350
= 0.641500
For n=3,
A3= A3-1 + 30.5/4*{1*(1/3)2}2*{3*4(3-1)}
(√3/4)*0.0370370372*48+0.641500
= 0.670011
We may assume that the formula holds true for all numbers of n including n=k. So the formula holds true for n=k.
Ak= Ak+1 + 30.5/4*{1*(1/3)k}2*{3*4(k-1)}
To prove it for n=k+1:
Ak+1= Ak + Uk+1
Where Uk+1 is the number of new triangles formed in the n=k+1 stage.
Ak + 30.5/4*{1*(1/3)k+1}2*(3*4k)= Ak+ Uk+1
Ak + 30.5/4*{1*(1/3)k*(1/3)}2*(3*4k) = Ak + 30.5/4*{1*(1/3)k+1}2*(3*4k)
30.5/4*{1*(1/3)k*(1/3)}2*(3*4k) = 30.5/4*{1*(1/3)k*(1/3)}2*(3*4k)
LHS=RHS
Hence the formula stands true for AK+1 as well.