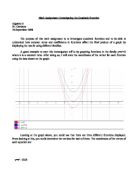
y= -3sin(x)
Figure 6
Figure 6 show that a negative whole number also changes the amplitude and maximum value to 3, and the minimum value to -3. The period of this graph still remains 2 π. But using the trace button on my graphing calculator, we can see that graph is inverted. I predict that if I replace A with a value smaller than 1, than the amplitude will decrease from 1. And if A has a negative value then the graph will invert.
y= 0.25sin(x)
Figure 7
In figure 7 it can be seen that the amplitude has decreased to 0.25. The maximum value of the base curve is 0.25, and the minimum value of the base curve is -0.25. The period again remains 2 π.
y=-0.25sin(x)
Figure 8
Figure 8 shows that the amplitude and maximum value has changed to 0.25 and the minimum value has changed to -0.25 and that the period remains 2 π. Again using the trace option on the graphing calculator, we see that with a negative value, the curve is inverted.
After examining the function y= A sin(x) with different values for A, I predict that when a number greater than one is placed before sin in the equation, the amplitude of the base curve will increase by ‘A’. And when sin(x) is multiplied by a negative number greater than one, the amplitude increases but the sine wave is inverted. When a number less than 1 is placed for the A value, the amplitude will decrease by ‘A’. Using different values for A does not change the period of the base curve, as it remains to be 2 π. I predict that if we change the value of A to 2/5, the amplitude and maximum value will decrease to 0.4 and the minimum value to -0.4, while the period remains the same.
Y= 2/5 Sin(x)
Figure 9 Figure 10
These graphs show that my prediction was correct, as figure 9 shows that the minimum value is -0.4 and figure 10 shows that the maximum value is 0.4, and both figures show that the period is 2 π.
Changing the value of constant B
I am now going to change the values of B in the equation y= sin(Bx) to see what affect it has on the base curve.
Y=sin (3x)
Figure 11
Figure 11 shows that the amplitude, maximum and minimum values have the same value as the curve y=sinx, i.e 1 and -1. The period of y=sin3(x) has decreased from 2 π to π/3. It is also noticed that increasing the value of ‘B’ to 3, the curve repeats itself three times within the period f 2 π. So this shows that large values for ‘B’ have a smaller period but a larger frequency. So this shows that ‘B’ affects the period which affects the frequency of the equation.
Y=sin (-3x)
Figure 12
Figure 12 shows that the amplitude and maximum value remain 1 while the minimum value remains -1. And that the period also decreased from 2 π to π /3. Once again using the trace option on the graphing calculator, we notice that using a negative value inverts the curve.
Y= sin (0.25x)
Figure 13 Figure 14
From figures 13 and 14 we can see that amplitude and maximum value once again remains 1, while the minimum value remains -1. Decreasing the value of ‘B’ to 0.25, the period is increased to 8 π, which means that frequency decreased.
Y= sin (-0.25x)
Figure 15 Figure 16
The amplitude and maximum value remains 1 while the minimum value of the graph remains -1. The period for this graph also increases to 8 π, shown in figure 16. The sine curve is also inverted because ‘B’ has a negative value.
After examining the function y=sin (Bx) with different values, it is noticed that when the value of ‘B’ is changed it affects the period and this affects the frequency (which is the number of complete cycles that occur every 2 π/ 360 degrees). If a number greater than one replaces ‘B’ in the equation, the period of the base curve. And when a number less than 1 is placed for the ‘B’ value, the period of the base curve increases. Using different values for the B does not change the amplitude or the maximum and minimum value of the base curve. Also if a negative number is used for ‘B’, there is no affect on the amplitude, but the graph is inverted.
I predict that if I change the value of B to 2/5, the period will increase to 5 π and the amplitude will remain as 1.
Y= sin (2/5x)
Figure 17 Figure 18
Both figure 17 and 18 show that my prediction is correct.
After examining what happens when we change the values of ‘A’ and ‘B’ in the function y= A sin B (x-C) +D, I am now going to predict what changes would happen to the base curve if I used the equation y= ½ sin (2x). I predict that the maximum value will be 0.5, the minimum value will be -0.5 and the amplitude will be 0.5. The period will decrease to π, so that the frequency is increased to 2.
Y= ½ sin (2x)
Figure 19
Figure 19 above shows that my prediction is correct.
Changing the value of the constant C
I am now going to change the values of C in the equation y= sin (x-C) to see what affect it has on the base curve.
Y= Sin (x+3)
Figure 20
Figure 21 Figure 22
In Figure 20, the amplitude and maximum value remained 1 and the minimum value remained -1 like the base curve y=sin(x). The period of the equation remains as 2π, but the curve shifted to the left by three units. Figure 21 and 22 shows how the sine base curve y=sin(x) shifted to the right when the value of ‘C’ was changed to 3.
Y= Sin (x-3)
Figure 23
In Figure 23, the amplitude and maximum value remained 1 as in the equation y=sin(x), and the minimum value remains -1. The period of the graph also remains 2π as the y=sin (x) equation. But the position of the graph has shifted to the right by three units. This shows that using a positive value, the base curve shifts to the left (towards the negative side of the x-axis) and using a negative value, the base curve shifts to the right (towards the positive side of the x-axis).
Y=Sin (x+0.25)
Figure 22
In Figure 22, the base curve shifts to the left by a ¼ of a unit (-4 degrees). The amplitude and maximum value still remained 1, and the minimum value still remained -1. The period also remains as 2 π.
After examining the function y= sin (x-C) with different values for C, it is noticed that the graph has a horizontal shift along the x-axis that is known as a phase shift. When any positive number is used for ‘C’ value, the base curve shifts to the left. This is not what I expected to happen, I expected the base curve to shift to the right (towards the positive side of the x-axis) when ‘C’ is added to x. And when ‘C’ is subtracted from x, I expected it to shift to the left, but the base curve shifts to the right. Using different values for ‘C’ (negative or positive) does not change the amplitude, maximum value, minimum value nor the period, as they still remain the same as in the equation y=sin(x).
After examining what happens when changing the values of ‘A’, ‘B’ and ‘C’ in the equation y= A sin B (x-C) +D, I am now going to predict what changes would occur if I used the equation, y=4 sin ½ (x-2). For this function, I predict that the maximum value will be 4, while the minimum value will be -4. Which means that that the amplitude will also be 4, because amplitude= (4 – (-4))/2= 4. The period will increase to 4 π and the base curve will shift to the right.
Y= 4 sin ½ (x-2)
Figure 23
Figure 23 shows that my prediction is correct.
Changing the value of constant D
I am now going to change the values of D in the equation y= sin(x)+D to see what affect it has on the base curve.
Y= sin (x)+3
Figure 24
In Figure 24 above, it is noticed that changing the value of ‘D’ to 3, the graph shifts vertically in the positive direction on the y-axis by 3 units. The maximum value is 4 and the minimum value is 2, and the amplitude remains as 1. The period also remains as 2 π.
Y= sin(x)-3
Figure 25
Looking at Figure 25, it is noticed that the subtracting 3 from the equation y= sin(x), that the base curve shifts vertically in the negative direction on the y-axis by 3 units. The maximum value of the base curve is changed to -2, while the minimum value of the base curves is changed to -4. The amplitude remains as 1 and the period remains as 2 π.
After examining the function y=sin(x)+D with different values for D, it was seen that when any positive value was placed in the equation for ‘D’, the base curve will shift vertically up the y-axis. And the maximum value of the base curve will be 1+’D’. If a negative number is placed in the equation, the base curve will shift vertically down the y-axis. And no matter what the value of D is, the period remains as 2 π and the amplitude remains 1. I predict that if I change the value of D to 2/5, the maximum value of the base curve will be 1.4, the minimum value will be -0.6. While the period remains as 2 π and the amplitude remains 1.
Y=sin (x)+ 2/5
Figure 26
Figure 26 shows my prediction is correct.
After examining what happens when changing all values in the equation, y= A sin B (x-C) +D, I am now going to predict what changes will occur is I used the equation y= 5 sin -2 (x-1) + ¾. I predict that the maximum value will change to 5, the minimum value will change to -5 and the amplitude will change to 5. The base curve is inverted because the ‘B’ value is a negative value and the period of the curve is decreased to π which increases the frequency to 2. The base curve also shifts to right by 1 unit and shifts vertically upwards by 0.75 (changing the maximum value to 5.75 and the minimum value to -4.25).
Figure 27
Figure 28 Figure 29
Figure 27 above shows that my prediction is correct. Figure 28 proves shows that my prediction about the maximum value being 5.75 is correct. And Figure 29 using the trace button shows that my prediction about the curve having a phase shift to the right by one unit.