Using this information I was then able to produce plot the points on a graph (using Autograph 3.2).
Note: In the graph it uses E+n. This is equivalent to ×10n.
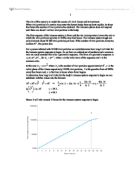
Again I chose the function y = a×10nx and using the Constant Controller option in Autograph I altered the constants a and n. Hence I was able to draw a curve of best fit:
Using the constant controller the value I got for constant a was 1000000 and for constant n it was 0.0496. This gave me the following equation for the curve:
y=1000000×100.0496x.
This gave me the following graph:
Model 2: The next phase of the illness, the immune response has begun and 50000 are particles are being eliminated. No medication has been issued yet
Using the equation found above, I was able to determine how long it would take for the patient to die (after there are 1012 particles):
y=1000000×100.0496x
y=1000000
x=Time
1000000000000=1000000×100.0496x
1000000=100.0496x
Log101000000=0.0496xLog1010 (Log1010 = 1)
6=0.0496x
x=120.97 (2 d.p.)
120.97hrs = 120hrs 58mins 12secs
120.97hrs is not how long it will take for the patient to die. As I mentioned above it would take 26.56hrs before the immune response would begin and so that has to be added. Therefore it would take (120.97+26.56) 143.53hrs = 143hrs 31mins 48secs for the patient to die.
To re-check my solution I added the equation y=1×10¹² to my graph. Using the ‘point mode’ in Autograph I was able to place a point where the two functions intersected:
As we can see in the red circle y will = 1000000000000 (1E+12) when x = 121(The programme has rounded it up.
Therefore, from both the methods it can be seen that it would take 143.53hrs = 143hrs 31mins 48secs for the particles to reach 1012 and the patient to die.
3. If the person is to make a full recovery, explain why effective medication must be administered before the number of viral particles reaches 9 to 10 million
To find out till what point the medication would be effective, I analysed what the medication would do when there are 8, 9 and 10 million particles. I decided to also try test the medication when there are 8 particles so that I could make sure that the medication definitely works effectively then.
Note: In the results, when there are less than 1 million particles, the fact that the immune system is not responding is not considered.
We know that the medication does not affect the rate of replication and therefore that would be 160% every 4 hours. To know how much the particles would replicate every 1hr, it would be (160/100)0.25 as it is a quarter of the total time (1.60.25 is the replication rate/hr). We also know that the medication together with the immune system would eliminate 1.2 million particles every 1 hour. Using this information I was able to produce a table using Excel:
8 million particles
Using this information I was able to plot a graph which would show the effect of medication when there were 8 million particles:
Model 3a: The effect of medicine after there were 8 million viral particles
As it evident from the graph, the particles go below 0 after 15 hours. Therefore if a patient took medication when he/she had 8 million viral particles then he/she would be fully cured between 15-16hrs as all the particles are eliminate then and thus the medication would be effective.
Now I went through the same process again but this time testing whether the medication would work effectively if he/she had 9 million viral particles.
The results can be seen on the following page:
9 million particles
Using the data above, I plotted a graph:
Model 3b: The effect of medicine after there were 9 million viral particles
Again we can see from the graph that the medication would be effective when it is administered to a patient who has 9 million viral particles. Such a patient would be cured between 23-24hrs as the particles are below 0 then. Its effect would be slower than a patient who has 8 million particles but they would still be cured.
Now I did the same for a patient with 10 million viral particles.
10 million particles
I used the data to plot another graph:
Model 3c: The effect of medicine after there were 10 million viral particles
It is evident from the graph above that the medication will not be effective. The particles will keep on increasing. Though the medication will reduce the speed of the process it will not be able to eliminate all the viral particles.
Now we know that when there are 8 or 9 million particles the medication will be effective. However when there are 10 million particles the medication is not effective. So it is clear that after a point between 9 and 10 million particles the medication will become ineffective.
To work find out what point that is, I used the following formula:
1200000 = p × (1.60. 25 – 1)
- 1200000 is the number at which the particles are eliminated using medication
- p is the number of particles
-
1.60. 25 – 1 is the rate of replication/hr in terms of %
1200000 = p × 0.1246826504
p = 9624434.485 (9624434 Rounded up)
So the last point at which the medication will be effective is 9624434 particles. If the medicine is administered before it reaches that figure than the patient can recover fully.
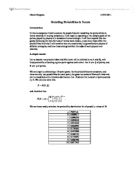
4. Create a mathematical model for this four-hour so that by the end of the four hour period the patient has 90 micrograms of medication in their body. Find the solution to your model analytically, or estimate its solution with the help of technology.
I can work out how many micrograms of medication need to be injected every hour by putting in a formula in excel using the information provided.
We know that 2.5% of the medication/hr is being eliminated by the kidney. Therefore we can say that after 1 hour there is 0.975 medication/hr.
Putting in the formula gave me the following results:
As shown above, I have come to few equations that show how many micrograms of medicine will be in the body after each hour. To tell how many micrograms of medicine one needs to inject into the body per hour, he/she has to use the fourth formula, as this is the end of the four-hour period.
As we can see from the data above, the 5th row of the table will give us the formula we need to use since it is the end of the 4 hour period.
90 micrograms = 3.756172266 medication/hr
medication/hr = 23.96056 micrograms per hour
23.96 (2 d.p.) of micrograms need to be injected every hour.
Using the previous figure (23.96056 micrgrams/hr) I created a table which showed how much quantity of medication there was after every hour and then I used the information to produce a graph.
Model 4: Quantity of medicine injected in the first 4 hours
From this we can say that 23.96 micrograms of medication needs to be injected every hour. We can also see from the graph that there is a straight line and therefore the rate is constant and hence there is continuous intravenous dosing and the same amount of medication is entering the body at a constant rate.
5. What dosage, D, administered every four hours from the end of the first continual intravenous phase, would allow for the patient to maintain at least 90 micrograms of the medication in his system? Make sure you take into account the kidney’s rate elimination. Explain carefully how you came to this number.
To work out D I used the following formula:
90 = (D + 90) × 0.9754
I got to this equation using a number by taking into account several information:
- We know the eventual medication is 90 micrograms.
- We use 0.975 because that is the medication used every hour as the kidney is eliminating 2.5% of the medication injected.
-
Since it is a four hour period and the same amount of medication is injected every hour we have 0.9754.
- We need to find out how much D is added to the 90 micrograms so that it is maintained after all the eliminating.
I then worked out D:
D = 9.591906601
D = 9.5919 micrograms (4 d.p)
To show how the dosage worked I made a table using excel. I multiplied the micrograms by 0.975 after every hour because the kidney is eliminating the dosage. The table shows how much quantity of medication there is after every hour.
Note: The rows highlighted in blue indicate the point where dosage (every 4 hours) was added.
I used this data to produce a graph:
Model 5: The quantity of medicine over a period of time – Dosage is regularly added
Note: The y-axis starts from 85 so that is easier to read and analyse the graph.
This graph shows the amount of medication inside the patient’s body every hour. The graph shows that the maximum point is 99.52 micrograms as this is the point where more dosage is added. It also shows that the kidney is eliminating 2.5% of the dosage every hour and therefore the quantity decreases gradually until more dosage is added. The graph shows that the minimum point is 90 micrograms and therefore that amount is maintained throughout the time period.
So through my methods it is clear that 9.5919 micrograms of dosage needs to administered to maintain the quantity of medication above 90 micrograms at any point.
6. Determine the last possible time from the onset of the infection to start the regimen of medication. How long it will take to clear the viral particles from the patient’s system? Show on a graph the entire treatment regimen from the time treatment beings until the viral particles are eliminated.
Since it has to be from the beginning, I started my working out when the patient was first infected i.e. there was 1 viral particle. We also know that the particles replicated at 200% every 4 hours before the immune response began. So to work out how long it took the immune response to begin once the patient was infected, I first created a table using excel and used the data gathered to produce a graph using Autograph 3.2:
When I plotted the data this is what the graph looked like:
The function I used to get the curve of best fit was y = a×10nx and I used the constant control option in autograph to find the best fit:
The value I got for constant a was 1 and the value I got for constant n was 0.0753. This gave me the equation for the curve of best fit for this curve which was: y = 1×100.0753x
Model 6a: Time taken for the immune response to begin after patient is affected
So to work out the exact time for the immune response to begin I used the equation I found:
y = 100.0753x
x = Time (hrs)
y = 1000000 since the immune response begins at 1000000 particles
1000000 = 100.0753x
Log101000000 = 0.0753xLog1010 (Log1010 = 1)
6=0.0753x
x = 79.68hrs (2 d.p)
So we now know that the immune response takes 79.68hrs to begin after 1 viral particle was found in the body. I also found out in question 3 that the last point at which medicine could be administered effectively was 9624434 particles. From 1 million particles onwards the particles replicate at 160% and 1.2 million particles are eliminated every hour. I therefore used the equation I found in Question 2 (y=1000000×100.0496x) to find out how long it would take the particles to replicate to 9624434 particles:
y=1000000×100.0496x
x=Time (hrs)
y=9624434 particles
9624434 = 1000000×100.0496x
9.624434 = 100.0496x
Log109.624434 = 0.0496x Log1010 (Log1010 = 1)
0.9833751987 = 0.0496x
x = 19.83hrs (2 d.p.)
So now we can find out the last possible time medication can be used effectively to eliminate all particles. It would be 79.68hrs + 19.83hrs = 99.51hrs.
99.51hrs= 99hrs 30mins 36secs is the last time when medicine can be administered.
If medicine was administered at the last point then to work out how long it would take for all the particles to get eliminated I used the formula I has in Question 3 [(particles*(1.6^0.25))-1200000] except this time I used the value 9624434 instead of 8,9 or 10 million.
For convenience the complete table is not displayed. However, here is an extract of it:
I then plotted a graph using all the values I found:
Model 6b: The treatment period – From when medicine is administered to when all the particles are eliminated
It can be seen that if medication was administered when there were 9624434 particles then it would take between 142-143hrs for all the particles to be eliminated and the patient’s health to be fully restored.
Strengths and weaknesses of my models and any assumptions made:
Model 1: Initial phase of the illness where there are 100000 viral particles
I believe that this model is quite reliable. It was straight forward to plot as there were not many calculations to be made. Its strength is that I found an equation that went through all the points showing that there was a link. From the graph we can find out the number of particles at any point. However that is assuming that the particles would follow that curve at every hour and minute. The only weakness I see in it is its axis intervals. Since they are so large, it is difficult to get an accurate reading.
Model 2: The next phase of the illness, the immune response has begun and 50000 are particles are being eliminated. No medication has been issued yet
The strength for this graph is again that there is a curve that fits through all the points showing there is a link. However, one of its major weaknesses is that until ‘88 hours’ it is impossible to take a reading. Due to the scale of the graph, all points up till ’88 hours’ is shown to be on 0 particles. This is not true and it can be see if the graph is magnified. Another minor weakness is that the y – axis is written in the notation ‘E+n’ and this can create confusion unless it is understood that it represents 1×10n.
Models 3a,b and c: The effect of medicine after there were 8, 9 and 10 million viral particles respectively
The fact that these graph show what happens at 3 different stages is its biggest strength. The question asks for only 9 to 10 million viral particles but also doing it for 8 million particles ensures that the hypothesis is correct at that stage. It also shows what is happening every hour rather than every 4 hours and therefore there is more detail.
Model 4: Quantity of medicine injected in the first 4 hours
The models main strength is that since it is a straight-line, it proves that the medication is the constant throughout the 4 hour period. However, one of its major weaknesses is that to produce the eventual graph I had to go through a number of processes and formulate several equations. Even if there was a slight error at any point the model could be incorrect. To some extent that is also a strength as we had to go step by step which were straightforward and would help understand the situation more.
Model 5: The quantity of medicine over a period of time – Dosage is regularly added
This model’s main strength is that it is easy to understand what is going on. Also because the axis intervals are not so large, it is also easy to read of. Its weakness would be that I had to collect information from the previous question as well and formulate a few more equations and therefore an error at some point could make the final model incorrect.
Model 6a: Time taken for the immune response to begin after patient is affected
This model’s strength is that it shows the growth of the particles from its initial stage i.e. when the first particle entered the body. Its main weakness is the intervals in the y-axis again. Due to this it seems as if the first for the first few hours the particles don’t replicate at all. This is not the case. If the graph was magnified, then it could be seen that in fact the particles are replicating but slowly.
Model 6b: The treatment period – From when medicine is administered to when all the particles are eliminated
The biggest strength of this model is that it sums up the whole medication treatment. However its weakness would include the fact the information had to be carefully gathered from throughout the document and any error at any stage could hinder the final result. Also because of the axis and the fact that in the initial stages the particles decreases slowly slightly it seems as if nothing is happening. If it was magnified upon then it could be seen clearly.
7. Explain how your models could be modified for use if the patient were not an adult, but a young child.
All the models through this coursework have been based on a standard adult patient. These models would vary from adult to adult as not everyone’s immune system would be the exact same. However, more or less the models would be similar as the values used in this investigation are an estimate of how an adult immune system works.
If the patient was a young child than the models would really look different because from my research I found that a child’s immune system is not completely developed until he or she is 14 years old i.e. the immune system of a child is weaker than that of an adult. Therefore the models would have to be modified in several ways.
- It says in the description that an adult’s immune system would reduce the replication rate from 200% to 160% every 4 hours. As a child’s immune system is weaker and therefore the rate will not decrease to 160%.
- Also a child’s immune system will not be able to eliminate as much as 50000 particles every hour like the adult one does.
- In the ‘Modelling Recovery’ section it states that together with the medication and the immune system, 1.2 million particles would be eliminated every hour. Again, as a child’s system is weaker, it will not be able to eliminate 1.2 million particles every hour with medication. Hence, for a child to make a full recovery, he/she must be given medicine before the particles reach 9624434 which is the figure for the last point of medication for a standard adult.
- Also, since the medication would not be as effective in a child, he/she will need more than the minimum of 90 micrograms of medication.
- If more than 90 micrograms of medication will be required than more dosage will be required to maintain that level.
- If I child was infected, then he/she would have to take medication earlier than an adult would to make a full recovery.
- Even when the medication was administered, it would take longer for a child to recover than an adult would.
As we can see from above, several figures would have to be altered and therefore all the models in my investigation would have to be modified.
(accessed on 28th Oct 2008)