2Ed Vitz, “10.6: Viscosity.” Chemistry LibreTexts, 2020, Accessed: 25 Aug 2019,
-
“Non-Newtonian Fluids.” Science Learning Hub – Pokapū Akoranga Pūtaiao, 2010, Accessed: Feb 2019,
Variables
Table 1. Independent and dependent variables.
Controlled variables
Table 2. Controlled variables.
Apparatus
-
1 Kg ± 0.0005Kg of mixed EU and non-EU honey from Poubeau4
- One large (20cm ± 0.05cm) jar
- A 10g ± 0.5g Spherical box
Method
1Kg of mixed EU and non-EU honey from Poubeau4 was place in a 20 cm high jar so it can be heated up. Then it was placed in a water bath of temperatures: 10°C, 15°C 20°C, 25°C, and 30°C. The honey was stirred to equally distribute the heat; in this experiment it was manually stirred with a spoon. Every time before the sphere was dropped, the temperature was measured with an electric thermometer; the thermometer was placed in different areas in the honey to be sure that the temperature was the same throughout. Then a certain amount of weights was placed in the spherical box depending on the mass wanted. The sphere also had a small amount of honey added to into it thus it weighed 10g.
First the honey was measured to be 15cm tall in the jar. All excess honey was stored in a separate container. The sphere was submerged in the honey then it was placed just above the honey with its bottom touching the top layer of the honey. The stopwatch was started while simultaneously dropping the sphere in the honey. When the sphere reached the end of the jar the timer was stopped, and the results were marked down. Then a spoon was used to pick up the box and the experiment was repeated 10 times for each different temperature with each different weight.
-
“Pot De Miel De Fleurs 1kg.” Boutique Poubeau, Accessed : 20 Dec 2019,
Raw data
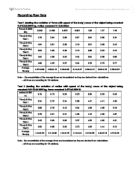
Table 3. Time taken in seconds for masses of 10g, 20g, 30g, 40g, and 50g to fall through 15cm of honey at temperatures: 10°C, 15°C, 20°C, 25°C, 30°C. (refer to the appendix for complete table)
Table 4. Average and standard deviation of time in seconds for masses of 10g, 20g, 30g, 40g, and 50g to fall through 15cm of honey at temperatures: 10°C, 15°C, 20°C, 25°C, 30°C.
Graph 1. Time taken for masses to fall through 15cm of honey over temperature.
Table 5. The R² value for each mass.
In previous studies5 on the viscosity of honey, it is shown that as the mass increases so does viscosity and as temperature increases viscosity decreases. It should be expected that as the mass increases, the time for the sphere to fall gets progressively smaller. Though the gap of time between 10g and 20g should be bigger than the time between 40g and 50g.
This is exactly what happens and what is observe. As temperature increases the balls sink quicker. Although the proportions for the mass differences are far too large compared to other studies the effects should not be nearly this large. In graph 1 the time interval between 10g and 20g is significant whereas the one between 20g and 30g is barely visible. This is probably due to the force of buoyancy. The ball at 10g is most likely very close to the density of the honey therefore is floating a lot. If this is true, it would explain why the gap is so large.
-
Diego Gómez-Díaz, “Effect of Temperature on the Viscosity of Honey.” Taylor & Francis, 2007, Accessed : 6 Jan 2019,
In the following paragraph, I will calculate the force of buoyancy of the honey on the masses to verify if my thoughts hold up. I will also measure how the viscosity of the honey changes to observe if it has non-Newtonian properties.
The density of my honey
The volume of the 1 Kg pot of honey that was used in this experiment had a 4.5cm radius at the bottom, 5.5cm radius at the top, and was 10cm tall,
v = 1 ∙ ((r1)2 + (r1)∙(r2) + (r2)2 ) ∙ h = 0.000788m3.
3
Therefore, the density = 𝑀 = 1
= 1269Kg/m3
r = radius (m) h = hight (m)
v = volume (m3) m = mass (Kg)
𝑉 0.000788
The force due to buoyancy
This force is the force that makes objects float and the 10g weight is most likely very close to that number, which would explain why it takes so long to sink compared to the others.
FB = ρ ∙ v ∙ -g
1269 ∙ (4 ∙ π ∙ (0.012)3) ∙ 9.81 = 0.0901 N
3
FB = force of buoyancy (N) ρ = density (Kg∙m-3)
g = gravity (N∙Kg-3)
The force due to gravity
This force will change depending on the mass used. I will place the masses in an increasing order. Fg = m∙g
-9.81 ∙ (0.01, 0.02, 0.03, 0.04, 0.05) = -0.0981, -0.1962N, -0.2943N, -0.3924N, -0.4905N
Fg = weight (N)
The resultant force
The resultant force excluding friction would be the buoyancy + mass.
For example, here is the calculation for 10g: 0.0901 + (-0.0981) = -0.0080N
Table 7. Resultant force for each mass.
Table 7 reveals large amounts of evidence in the difference between the 10g and all the other weights. This was due to buoyancy, as the table shows the 10g mass’ resultant force is less than 12 times smaller than the 20g, where the 20g is about half as small as the 30g. This shows just how weak the acceleration is, it is near zero which is why the force pulling it down will take a very long time.
Viscosity of honey
The viscosity of honey should change depending on the mass placed in it, the formula used takes into account the force of buoyancy for the most part.
Viscosity = (2 ∙ (sphere density – honey’s density) ∙ gravity ∙ radius of sphere2) ÷ (9 ∙ velocity)
Tab 8. Viscosity of honey depending on the mass placed in it and its temperature.
Sphere density = mass of sphere ÷ volume of sphere = 6906.1 Kg∙m3 Velocity = distance ÷ time = in m∙s
Viscosity in pascal per second
Graph 2. How viscosity in honey changes with temperature.
Graph 3. How viscosity in honey changes with mass.
Graph 2 shows the change in viscosity of the honey as temperature increases. These values present the same values as the past studies6 suggested with the exception of one set of values: the
6 Saxena Sudhanshu, “Rheology of Indian Honey: Effect of Temperature and Gamma Radiation.”, International Journal of Food Science, 2014, Accessed : 4 Jan 2019,
10g. I believe this might be due to the buoyancy and the formula used might not be practical for such cases, however it could also come from the much larger uncertainty of the 10g. In the experiment the standard deviation of the 10g was usually twice as large as the rest of the masses, whereas all the other masses’ standard deviation somewhat resembled each other.
Graph 3 shows how the masses dropped into the honey affected the viscosity. Here a straight line is observed, it gets stepper the colder hence the honey is more viscous. This is expected, though in this graph there is a problem, it is the 10g. All the values line up properly with exception of the 10g which have an abnormally high viscosity compared to the rest, especially for 10°C, 15°C and 20°C. It can be observed that as the temperatures get higher the abnormal effect of the 10g weight becomes less visible. This might be due to the force of buoyancy becoming weaker as temperature increases. This due to honey expanding when it is warmed up and as a result becomes less dense.
Table 11. Possible future improvements
Conclusion
From this experiment I have concluded that increasing temperature reduces the viscosity of honey and that the viscosity of the honey increases when stronger forces are applied to it. Though no matter how the 10g mass was represented, it is always off, this could be due to many factors. One of those factors that has not been addressed is the fact that honey is a thixotropic fluid and for this reason testing honey several times in a short span of time might have changed the results. Another reason not mentioned yet, is that the honey used had a density near 1250Kg m-1 where other studies7 used honey with a density near 1400Kg m-1
7 “Viscosity of Flower Honey (Blended).”, Anton Paar, Accessed : 4 Jan 2019,
Bibliography
-
David Moonay, “What Is Shear Rate and Why Is It Important?”, Labcompare, 2017, . .
-
Ed Vitz, “10.6: Viscosity.” Chemistry LibreTexts, 2020, .
-
“Non-Newtonian Fluids.” Science Learning Hub – Pokapū Akoranga Pūtaiao, 2010, .
-
“Pot De Miel De Fleurs 1kg.” Boutique Poubeau, .
-
Diego Gómez-Díaz, “Effect of Temperature on the Viscosity of Honey”, Taylor & Francis, 2007, .
-
Saxena Sudhanshu, “Rheology of Indian Honey: Effect of Temperature and Gamma Radia- tion.” International Journal of Food Science, 2014, .
-
“Viscosity of Flower Honey (Blended)”, Anton Paar, .
Appendix