Controlled Variables:
A control of this experiment would be using the same type of cup with the same size throughout the experiment. The size of the cup would be measured by using a paper mm ruler to measure the diameter of the bottom of the cup. Another control of this experiment would be using the same stopwatch to time the drainage time and graduated cylinder to measure the water each time. Another control variable would be using the same amount of water (50 mL ± 2 mL) each time. This is measured with a 250 mL (± 2 mL) graduated cylinder. Another control of this experiment would be having the same person timing the experiment for every trial. Another control would be puncturing the same size hole at the bottom of the cup throughout the trials. This can be achieved by using the same screwdriver each time to punch through the cup.
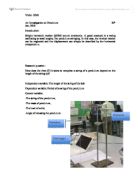
Apparatus and Materials:
- Water
- Graduated Cylinder 250mL ±2 mL
- Stop watch: (MyChron ± .01 s)
- Screwdriver (diameter 1cm)
-
Five paper cups; Height: 9.5 cm (±.5mm); Radius of the bottom: 3 cm (±.5mm)
- Ring Stand
Procedure:
- Obtain one paper cup and estimate the middle. Once the middle is found, use a screwdriver to puncture one hole into the cup. (If puncturing more than one hole, puncture the additional holes around the middle hole)
- Place the cup on the hole of the ring stand. The ring stand should be in the sink.
- Measure 50 mL (±2 mL) of water in a graduated cylinder
- Hold a stopwatch in one hand and hold the graduated cylinder in another. Slightly tip the graduated cylinder until water comes out.
- Start timing once the water hits the cup. Stop the stopwatch when the cup stops dripping water. Record.
- Once all of the trials for the cup with one hole are recorded, repeat step one with the cups needing 2 holes, 3 holes, 4 holes, and 5 holes.
- Repeat steps 2-5. Record.
Data collection and processing
Data Table:
Table 1: The Number of Holes at the Bottom of a cup and Water Drainage Time (± .01 s)
Data processing:
Average Time (s) when the number of holes at the bottom of the cup is 1
(27.93s + 28.60s + 26.69s + 26.62s + 27.31s) / 5 = 27.43 seconds
Uncertainty for when the cup has one hole
(28.60s-26.62s)/ 2 = .99 s
Graph:
Conclusion and Evaluation
Conclusion:
Based on the data collected, the hypothesis is accepted because as the number of holes increased, the drainage time decreased. This is evident in the data collected because when the cup only had one hole at the bottom, it took an average of 27.43s (± .01 s) for the water to drain whereas it only took the cup 9.96 s (± .01 s) for the water to drain in the cup with 5 holes. The graph is at a negative slope. This is due to the physical barrier of the paper that prevents water from dripping thus as the number of holes increased, the drainage time decreased.
Weaknesses and Limitations:
One of the biggest weaknesses in this experiment was the human error with the reaction time when starting and stopping the stop watch. It is impossible to correctly start and stop the stop watch exactly when the water would hit the surface of the cup because of human reaction time (time needs to pass before the thought from the brain reaches the hand to start and stop the stopwatch). This serves as a limitation because although the stop watch was controlled by the same person each time, a different time lapse will pass each time thus causing the inability to accurately time the instant the water hits the cup. Another limitation to this experiment is that the same amount of water does not drain out each time because some drops of water are collected to the side of the cup even though 50 mL (± 2 mL) of water is poured on each trial. This may cause some trials to have a longer time period for the water to drip out because the water is not dripping down (from the collection on the side). Another limitation would be that even though the cup is placed on the ring stand, the water being poured still causes the cup to tip thus allowing the water to drain quicker or slower at certain angles.
Investigation Improvements:
There are several ways to improve this investigation to make the data more accurate. To reduce the skewing effect of the water collecting on the side, one could have tested different cups to see which is the best at water drainage. If all of the cups still collected water on the sides, then more trials could have been tested to get a better average of the times it took the water to drain out. Thus there would have been less skewed points. Another way to improve this investigation would have been to tape each cup to the ring stand so that the cup would not have tilted at an angle when the water was poured because certain angles allowed the water to drain faster or slower due to shape of the bottom of the cup.