Results
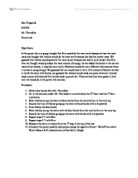
Below in the table of data we have 5 different measurements, and each measurement is repeated 5 times.
The uncertainty in Height is estimated to be ± 0.001(M), as it is the last decimal number of the height measurements.
Displacement (S) Uncertainty is attained by subtracting the smallest measured Displacement from the biggest measured one, and then by dividing the difference by 2, we get the uncertainty in Displacement, and we can see that 4 of the Displacement measurements have the same uncertainty.
S: Displacement/ M: Meter
Graph
Conclusion
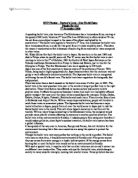
From the graph it can be seen that whenever the height of the water in the bottle (which gives PE to the water) is higher and increasing, then the displacement of the water will increase also (the displacement here is X in the 1st picture of the practical, and it is the distance which water cuts when it comes out of the pipe into the pocket).
But also one can notice from the graph that it is not linear, but it is close to it, and we can see where the errors happened on the graph. that tells us that my conclusion is right, but it is not increasing in the same pattern, but in different ones.
To find y, we use the equation (h= x2/4y), and by making Y instead of H, we get Y= x2/4h, and then by obtaining H from the graph (which is the slope, we have the solution:
So, Y= 12/4(0.06783) ➔ Y= 1/0.27132 ➔ Y= 3.686 M
Evaluation & improvements
Practicals are always expected to face some problems while someone is doing them, same here when we first faced the problems of the width of the pipe and the water which was leaking from the bottle. In general the practical was really successful as I see it, and we managed to do it, but there were some things need to be taken into consideration next time.
For example, next time it will be good if the pipes been checked before if they are capable of letting the water flow, and make the bottles closed better so they don’t leak, also it will be good if there was something to close the pipe while filling water and to open it so it can start getting out of the pipe (we used our hands, but there some things that might be more efficient). Using more precise rulers or tools of measuring lengths and heights can be useful and help in making the uncertainties a lot smaller and better.
After all, the practical is done with some errors and mistakes that are clear in the graph, and I think this graph can be made a lot better if we use the suggestions above or similar ones.