Coefficient of Friction: The coefficient of friction was taken away because of the equipment that we used. For example we had the frictionless car that helped reduce the friction greatly; also the ramp let the wheels fit into the plane which made the friction almost definitely
Aspect 3:
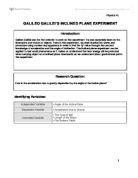
Procedure
- Set up your equipment
- Make sure you put your logger pro equipment together
- Set up ramp and measure the height (varies)
- Measure distance of ramp (100 cm)
- Measure your height of books and consider that as your opposite
- Measure length of ramp and consider that as you hypotenuse
-
After measuring the two side use the equation sin-1 (Opposite/Hypotenuse) to derive the angle and note it down
- After measuring the angle you can set up the motion detector 40 cm from the ramp
- Make sure the motion detector is picking up a signal
- Once the motion detector is picking up data, take the data
- Release car from the ramp and begin collecting data by pressing the collect button
- For preciseness 2 trials will be done for every angle, 10 angles will be recorded
- Repeat steps for other 9 angles
Data Collection and Processing:
Aspect 1
Recording Raw Data
Uncertainties:
- Meters: 1m ± .05cm
- Centimeters: 1cm ± .05mm
- Acceleration: 1 ± 0.005
Table of not averaged and averaged trials:
Aspect 2:
After recording the two trials and getting two accelerations for one angle, we average the two acceleration and we get the average acceleration through this table and below is the graph of the average acceleration:
Considering in mind that this lab is on acceleration we can derive the exact formula for acceleration and plug in our data:
The table below provides what the actual acceleration would have been according to the data and below is the graph of the points:
Aspect 3
Percent Error=
Angle: 5.57
.95-.65 *100
.95
Percent error= 32%
According to our graph above which is the points we got from our lab; we can say that as the angle of inclination increases then the average acceleration would increase. Except for a few exceptions its is proved through our graph that the acceleration is increased as the angle is increased, but for those exceptions we may be able to say that error was involved as 30% is quite high.
Conclusion and Evaluation
Aspect 1
We found our data using two different methods and different numbers for each and generally got different answers. By looking at all of our data we can come to the conclusion that the angle of inclination does not affect the acceleration. Like our Projectile Motion lab that we have done recently the projectile went a certain distance at a certain angle and then after changing the angle the distance would decrease after a while. We can say the same for this Lab as that when the angle is lower than 90 the acceleration would increase until the angle is above 90 and the acceleration will decrease again. This is because if one looks at this problem it makes sense. The car will go much faster until the ramp if perpendicular to the ground and when you lower the ramp to 180⁰ then the car will barely have any acceleration considering there is no friction. In our Lab we can calculate that there is about 32% error which is very high, but for several reasons is true. I believe that this 32% error was taken because of random and systemic errors meaning that what we did made the error much higher than it should be and also the fact that the instrument was a bit hard to work with. One random error was that we definitely did not collect data and that if we did collect more data the results would be much more precise then they are. Another Random Error was the time that we used, we may have not used the time to our best accomplishment as it took much time to prepare and also take all the data down. A Systemic error that occurred was with the frictionless car as the motion detector took a lot of time to detect the car and we had to measure at which height the car would be detected. This took several pre trails of which none were counted.
Aspect 2
Our results from which we got from the lab compared to the gsinѲ results were not that much different, however there were certain points that did not match up. From my overall look I can say that the design and method of the investigation was good. There were few weaknesses in the lab, such as the motion detector taking time to set up as well as getting it to work properly which may have increased the error. Another weakness was our time management which was not up to par, where in this case we were at times working to fast and rushing a lot as we didn’t have much time left which affected our data greatly. Another weakness was when averaging the acceleration we only had constant acceleration for about 1 second in which we averaged those numbers together. The precision of the data was decent as our motion detector was quite accurate.
Aspect 3
For the few weaknesses I had I can say there are simple solutions for them to be avoided next time. With the motion detector I think we could first find a proper height for both the ramp and the car to be placed at and whenever we raised the ramp we would raise the motion detector by the same amount. Next was the time management where as always we could have stopped rushing and taken our time even though it was scarce, this was because we had to do this lab during a time with constraints. The last weakness was with the acceleration and my solution is to increase the length of the ramp and let the car run for more time and thus we will get a more detailed acceleration. To remove systemic/ random error next time we would have to make sure we have more time for the experiment and set up properly.