Materials & Procedures
Materials I will use to conduct the pendulum lab are string, bob (1000 grams), T-bar, meter stick, and a stopwatch. One of my classmates will contribute to the experiment using a stopwatch to measure time while I conduct the procedures.
1. When all the materials are gathered, attach the T-bar to the lab table.
2. Tie the string to the T-bar 30 centimeters away from the peak.
3. Tie the bob (1000 grams) to the string and adjust the length of the string to designated amount, may need adjustment from the string that is tied to the T-bar.
4. Set the bob next to the bar, check if the classmate is ready to start the time.
5. Count 3, 2, 1, 0 so that it is more accurate to start the stopwatch and the oscillation at the same time.
6. After ten oscillations, stop the stopwatch and record data.
7. Repeat step 4 through 6.
8. After ten trials, alter the length of the string and repeat step 4 through 6.
Data and Analysis
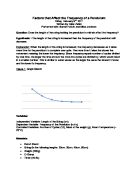
The table below presents raw collected data of the experiment, which includes the increase in length of the string and the time trials from ten oscillations of each length of the string. It also contains the average and the uncertainty of the whole trials from each length.
Looking at the table, it can be stated that as the length of the string increases, the amount of time it takes to complete one oscillation of left and right increases. The explanation for this outcome is that the bob has more distance to travel whenever the length is extended, as there is more distance in the same amount time (ten oscillations), the velocity of the pendulum decreases, which hence increase in time period.
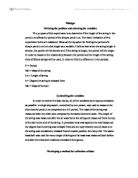
The graph above indicates increase in time (s) as the length of the string is gradually increasing, it is reasonable to say that two variables form a linear relationship between each other. The graph includes line of best fit, steepest fit, and least steep fit from the graph as drawn and the equation for each of the line. There is only a slight difference between three of the fit lines due to the small number of uncertainty from the table above. The gradient of the best-fit line is reported as .0602, but since there is uncertainty between the points to determine the line, there is also an uncertainty in the slope of the best-fit line.
The absolute uncertainty in the best-fit gradient is:
Conclusion
Overall, the experiment was conducted with few minor errors was and followed the given procedure. The best-fit line on the graph revealed a linear and chance of proportional relationship between two variables. In the calculation, the percentage of uncertainty from the gradient of best-fit line was 2%. One factor that affected the motion of the pendulum was the length of the string as it is the independent variable in this experiment, as table shows an increase in time whenever there is an increase in the length of the string. Since the bob has more distance to travel every time the length increases, the velocity decreases, therefore increase in amount of time it takes to complete ten oscillations.
Self Improvement
To avoid any flaws or errors, several actions are necessary to enhance the outcomes of the experiment.
1. Instead of using the experimenter's hand to release the bob to start time, may cause acceleration to the bob or inaccurate timing. It would be logical to use a machine to release the bob so for every trial, it does not affect the bob and has accurate timing of the release.
2. Using one of the classmates to start the stopwatch causes a gap between the bob releasing and pressing the button for the stopwatch at the right time to start. I would use a laser sensor device that whenever the bob passes certain point, the device starts to measure time and stop after ten oscillation.
3. It imperative for the T-bar to remain stationary during the experiment, to do so, an extra weight on the bottom of the stand will immobilize the T-bar. Make sure the weight does not interfere with the pendulum.