Weigh all the paper rockets, the chemistry textbook as well as the eraser with tape that will be placed inside the rockets.
Tape an empty two litre plastic bottle’s opening to the L shaped tube to make the launcher used to blast the rockets.
Go to an indoor open area with a high ceiling to set up the experiment.
Tape a meter stick to the middle of the launcher where the launcher is tilted at fifty degrees in respect to the ground. Secure the meter stick and launcher with the plastic bottle section placed parallel to the ground.
Secure tape measure from directly below the top of the launcher and spread it out straight with respect to the launcher.
Measure twenty centimetres away from the plastic bottle and place a marking.
Tape the eraser inside the full sized paper rocket in order for the rockets to be less affected by air resistance.
Place full sized paper rocket on the opening tube part of the launcher.
Make a person stand at the marking while holding the chemistry textbook at one meter from the ground and directly above the plastic bottle.
Release textbook, then mark the distance in which the paper rocket has landed the ground first closest to the tape measure.
Blow into the opening tube of the launcher to reform the crushed plastic bottle into its original shape.
Place full sized paper rocket on the opening tube part of the launcher again and complete five trails in total of the same paper rocket.
Complete procedure 11 to 16 for all other paper rockets.
Results:
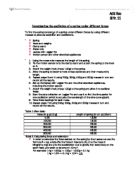
Below is a table of data of five trails performed for each of the four different paper-sized rockets.
The uncertainty in distance is estimated to be ½ of the smallest division of the tape measure (1cm).
The measurements were taken from the tape measure placed directly below the launching point to a point on the tape measure that is closest to the point where the rockets first landed (from a one dimension point of view). In some trails the rockets did not fly straight.
Some obviously wrong values were omitted and those particular trials were performed again.
An average distance is taken from the five trails of each rocket.
Below is a table of data of the mass of the materials used.
The uncertainty in mass is estimated to be ½ of the smallest division of the scale (0.01g).
Maximum value is calculated by taking the largest value of the series and subtracting by the average value.
Minimum value is calculated by taking the average value and subtracting by the minimum value.
Conclusion:
My hypothesis where as the mass of the paper rockets increases, the distance travelled will decrease because the mass of the rocket is heavier with more amount of paper used is not supported. A proportional relationship cannot be implied by the graph since the best fit line is not within the error range. A reason for this may have been because the location where this experiment was conducted had ventilation systems which may be influenced the rockets. Also, in some trials, the rockets did not travel straight but since we only considered distance one dimensionally in this experiment, some results would have been larger if the distance was measured from the launching point. For the future, instead of four, a larger variety of differently massed rockets could be used. Also, the height (looking from a three dimensional point of view) as well as different shapes of rockets can also be experimented for further exploration.
If this graph was considered as a linear graph, the gradient would be -0.2142 m/g
The uncertainty of can be found from maximum and minimum lines.
Maximum slope = 0.0664 m/g
Minimum slope= -0.4693 m/g
Uncertainty = (Max-Min)/2 = 0.3 m/g
The gradient is therefore -0.2142 m/g ±0.3 m/g