Method:
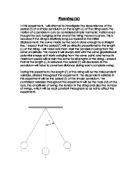
- The apparatus was arranged as described and shown in the figure
- The radius of the bob and the hook length was measured using the vernier caliper.
- Hence the string length was calculated as length of string + length of hook + radius of the bob
- The length of the pendulum was altered by reducing the length of the string used.
- The bob was attached to the string, and then the string was measured so as to account for the radius and length of the bob
- The same bob was used throughout.
- With the help of a protractor, the amplitude was kept constant to ensure that the pendulum swing always started from the same place.
- The 10 number of swings were timed using a stopwatch.
- A piece of paper was placed exactly behind the pendulum with a line marked on it. This line was used as the reference point from which the timing was started and stopped and was measured with the help of a protractor as 4 degrees
- Markings were made on the string with the help of a metre rule and a pen and 50cm, 40cm, 30cm, 20cm and 10cm were marked with the bob attached to it.
- After taking several readings for each string length marked for increased accuracy, the string was cut at the marked point with a scissor.
Data Collection
Radius and length of the hook:
Value of the smallest division on the scale (M): 0.1 cm
Total no. of divisions on the vernier scale (n): 10
Least count (L.C) of vernier caliper: 0.01 cm
Zero error: ± 0 cm
Hence there is no zero error correction
Length of the hook = Full length – Diameter = (2.91 – 1.94) cm = 0.97cm ± 0.1cm
Hence Length of the hook ≈ 1cm ± 0.1cm
Radius = Diameter ÷ 2 = 0.95 cm ± 0.1cm
Pendulum
Total length of the string = String length + length of hook + radius of the bob
Therefore total uncertainty in the length = 0.1 + 0.1 + 0.1 = ± 0.3cm
Due to the reaction time in starting and stopping a timer, the uncertainty in the total time X will be about ± 0.5 s
Data Processing and Presentation
As I had predicted that the period (T) will be directly proportional to the length (L) of the string, this will be verified by plotting a graph of length (L) versus period (T)
First we have to calculate the average out of the 3 readings after which we can calculate the period (T) of the pendulum by dividing the average recorded values by 10 as 10 swings were taken for each reading and I shall round them off to 2 significant figures
Now, we can divide the average reading by 10 to find the period (T) of the pendulum.
Now plotting a graph of Length (L) versus Period (T), the line of best fit should pass through the origin to indicate a direct proportionality relationship as was predicted.
However, we can see that the line of best fit passes through the point far away from the origin and not through the origin as was required for my prediction to be correct. Hence there is an obvious error in my prediction and it must be false.
Now, plotting Length (L) versus Period2 (T2), we get the following graph on the next page
As we can see the best fit line passes straight through the origin within the error margin, hence we can see that the length (L) of the string is directly proportion to the square of the Period (T), unlike what I had predicted.
Conclusion and Evaluation
I had predicted that period (T) will be directly proportional to the length (L) of the string, however as seen from the graph, the best fit line does not pass through the origin hence they are not directly proportional. Hence I plotted a graph of length (L) versus the period2 (T2) and in that graph as seen the best fit line passes through the origin. Hence we can see that the original prediction was wrong and in fact length (L) is directly proportional to the period2 (T2).
Limitations, weaknesses and errors in the procedure:
- As the pendulum was set into motion manually, this could have resulted in various errors. It was observed that at times, perhaps due to unsteady hands, the pendulum did not follow a completely straight path and sometimes followed a slightly circular path, which could have resulted in a higher value for the period. Also, it may have received a slight initial push that might have affected its swing velocity.
- There may have been errors in measuring the amplitude due to unsteady hands, thickness of the string and difficulty keeping the protractor perfectly level.
- There may also have been errors caused due to human reaction time in stopping the watch while determining the exact moment when the pendulum reached the highest point of its trajectory.
Improvements that can be made for the adopted procedure:
- A clamp can be used to hold the bob at the required angle before setting it in motion to avoid any initial push it may have received. Also, this will solve the problem of a slightly circular path being followed due to unsteady hands as the clamp will be perfectly steady during all trials.
- String of a longer length can be used as this will increase the accuracy in the following 2 ways:
- Any error due to the instruments used in the measurement of the length will not be as noticeable with a longer length as compared to a shorter one. In other words, an error of 0.3 cm is more significant with string length of 20cm than it is with a string length of 100cm.
- Due to a longer string length, the period will also be longer and hence any errors due to the human reaction time in the measurement of the period will be substantially reduced.
- The flight path of the pendulum can also be made straighter by restricting it by placing 2 glass screens on both sides. The closer they are kept, the more straight the path it will follow. However, care should be taken to ensure that the string does not come into contact with the glass screens as this will affect its path.