Dependent Variable: Resistance of pencil lead
Controlled Variables:
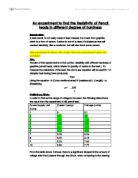
Table 1: Table showing controlled variables which are kept constant throughout the novel to prevent unexpected results
Materials:
- Power supply
-
Conducting Wire (20.0 ±0.1cm)(x2)
-
Ruler (30.0 ±0.1cm)
- Pencil Lead with the radius of 1mm (with the length of 9.0cm)
Figure 1: Figure showing pencil leads which are used during the experiment
-
Thermometer (±0.1°C)
-
Barometer (±0.1atm)
Procedure:
- Before starting the experiment measure the temperature and atmospheric pressure of the medium where the experiment takes place to keep it constant. Since the experiment is repeated in the same room, temperature and atmospheric pressure is kept constant in that way. However, as a precaution keep measuring these values with thermometer and barometer to be sure that there is no unexpected changes in the results due to these values.
- Bind one end of conducting wire to power supply and other to the end of pencil lead.
- Bind one end of other conducting wire to 9.0cm away from the other one which is bound to pencil lead before, measure the distance between two conducting wires on the pencil lead with ruler. Then bind other end of conducting wire to power supply.
- Keep voltage of the power supply constant at 1.0V.
- Get measurements of current as soon as you turn on the power supply.
- Record data you have taken to data table.
- Repeat this process for different lengths (8, 7, 6, 5, 4, 3, 2, 1, 0 cm) of pencil lead between two conducting wires.
- Make sure you make at least 5 trials to get more precise results.
Figure 2: Sample figure of the experiment
DATA COLLECTION & PROCESSING
Table 2: Length (cm) of pencil lead between two conducting wires to current (A) of the system
Resistance of the pencil leads which have different lengths are calculated with the formula given below:
Table 3: Table showing current (A) of system to resistance (Ω) which is different for different lengths of pencil lead between two conducting wires
Graph 1: Graph showing the relation between resistance (Ω) of pencil lead and length (m) of pencil lead
where;
When these two equations are combined, a new equation which is shown below comes out:
Cross sectional area of pencil lead is going to be calculated by using the formula of
where:
Radius of the pencil lead (r): 1mm = 0.001m
π: 3.14
Uncertainty Calculations:
CONCLUSION & EVALUATION
In this experiment resistivity constant of pencil lead is aimed to be found. In order to get results a power supply is bound to a pencil lead with two conducting wires. Current value which is shown in the screen of power supply is recorded to data table. During the experiment some factors which may affect the result like voltage, temperature, conducting wires, radius of pencil lead etc. are kept constant to prevent some unexpected results.
First of all current values which are obtained as a result of the experiment are used to find resistance. For each length of pencil lead resistance is calculated by the help of the formula of
, where R is resistance, V is voltage and I is current. Then a graph showing the relation between length of pencil lead and resistance is drawn. Slope of the best fit line of the graph is used to calculate resistivity coefficient of pencil lead. Slope of the best fit line is equal to
where R is resistance and L is length of pencil lead. By using another formula which is
, another equation which is as below is obtained:
As a result of these steps shown above and the experiment, resistivity coefficient of pencil lead is found as
. This uncertainty shows that the experiment has lots of error sources and limitations.
First and the most significant one these error sources could be itself of the pencil lead. In this experiment it is tried to be found the resistivity coefficient of the pencil lead. However, the lead used in pencil may not be pure. That’s why the results are much more than expected. Using pure lead would be a solution for such this error.
Another error source can be temperature. High temperature would cause pencil lead to expand and this would also increase its resistance. As a result, calculations would be made with greater values and the results would be more observable and accurate.