The weakest force of the universe
THE WEAKEST FORCE IN THE UNIVERSE By: Risa Santoso 11 Diploma Everything in the universe is made up of matters. Forces are what keeps everything from falling apart. Gravity, which are said to be the most dominant force in the universe are said to be the weakest force. To determine whether it is true or not, it is best to understand all of the fundamental forces first so to analyze them. There are a total of 4 fundamental forces of the universe; the gravitational force, the weak nuclear force, the electromagnetic-force and, the strong nuclear force. As mentioned above, all the forces in the universe are based on the four fundamental forces. The strong and weak forces worked at very short distances. They are also responsible for holding certain nucleons and compound nuclei together1. The electromagnetic force acts between electric charges and the gravitational force acts between masses. The last two forces have an infinite in range. The four fundamental forces have its own usages and calculations -they are very different in nature. To compare the strength of the fundamental forces, a dimensionless constant should be searched (to find the relative strength of each of the forces). This dimensionless constant is called the coupling constant. First we can compare the coupling constant for the strong interaction in comparison to the electromagnetic force. It is clear that the

Ticker-timer
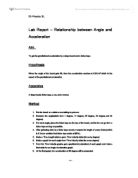
Report Aim: To calculate the acceleration of the dynamic trolley by using various methods.For eg. Ticker Timer, Motion Sensor. Theory/backround information: Acceleration is the rate of change in velocity. Therefore, a=(v-u)/t ;where u is the initial velocity, v is the final velocity and t is the time taken. Part 1: Ticker Timer Materials: * Dynamic trolley * Ticker timer * Carbon/paper tape * Wooden blocks * Table * Cello tape * Electricity appliance Method: . Take one or two wooden blocks and put them under the table to tilt the table. 2. Place the ticker timer at the top of the table but make sure that it should not fall due to the slope of the table. 3. Conect the ticker timer to the electricity appliance. 4. Insert the carbon/paper tape inside the ticker timer. 5. Paste the carbon/paper tape, which is on the front side of the ticker timer, on the backside of the dynamic trolley with a cello tape. 6. Start the ticker timer and release the trolley. 7. Stop the ticker timer when trolley reaches the other end of the table. But assure that before trolley falls down, it must be stopped. 8. Then continue the same procedure three times but with new carbon tape and then record the data. 9. Find the velocities by counting the fifty dots(the ticker timer makes fifty dots in one second). Then by counting first five dots and then measure the length by ruler
Relationship between Angle and Acceleration
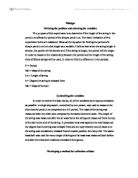
Lab Report - Relationship between Angle and Acceleration Aim To get the gravitational acceleration by a slope board and a ticker tape. Hypothesis When the angle of the board gets 90, then the acceleration reaches at 9.81m/s2 which is the speed of the gravitational acceleration. Apparatus A slope board, ticker tape, a car, and a tractor. Method . Put the board on a table or something to put over. 2. Measure the angle(starts from 1 degree, 11 degree, 22 degree, 33 degree, and 44 degree) 3. For each angle, place the ticker tape on the top of the board, and let the car go from a ticker tape as long as possible. 4. After gathering data by a ticker tape record, measure the length of every 6 dots (which is 0.1secs consider that ticker tape works at 60Hz). 5. Make a Time-Length table to get a Time-Velocity table (for every degree). 6. Make a graph for each angle from Time-Velocity table (for every degree). 7. From the Time-Velocity graphs, get a gradient (Acceleration) of each graph and make a final table for an Angle-Acceleration graph. 8. At the final graph, the acceleration at 90 degree will be presented. Data collection & Data analysis Time-Length Table Angle Length (m) 0.004 0.005 0.006 0.007 0.008 0.009 1 0.034 0.046 0.06 0.073 0.085 0.098 22 0.058 0.0945 0.13 0.173 0.21 0.284 33 0.074 0.124 0.172 0.22 0.315 0.308 44 0.095
The purpose of this experiment is to determine if the length of the string in the pendulum affects the period of the simple pendulum. The main limitation of this experiment is the air resistance
Design Defining the problem and selecting the variables The purpose of this experiment is to determine if the length of the string in the pendulum affects the period of the simple pendulum. The main limitation of this experiment is the air resistance. Because the equation for finding the period of a simple pendulum includes length as a variable, I believe that when the string length is shorter, the period will be shorter and if the string is longer, the period will be longer. In order to measure the relationship between the period and the length of the string, three different strings will be used, in order to find the difference in the periods. P = Period Ms = Mass of the string Ls = Length of string ? = Degree the string is released from Mb = Mass of the ball Controlling the variables In order to receive the best results, all of the variables were kept as consistent as possible. A single stopwatch, controlled by one person, was used to measure the time that the pendulum completed one full period. The mass of the string was measured after the trials were complete by the same electronic scale. The length of the string was measured after the all was tied to the string and measured from the top of the ball to the end of the string. A protractor that was taped to the roof measured the degree that the string was released from and an experimenter would make sure the string

Aim: To investigate the conservation of kinetic energy and the conservation of momentum in an oblique collisions between two objects.
Lab: Oblique Collisions in Two Dimensions Aim: To investigate the conservation of kinetic energy and the conservation of momentum in an oblique collisions between two objects. Hypothesis: By law of conservation the momentum and kinetic energy should be conserved in an oblique collision between two objects however in our case I hypothesize there will be a slight difference due to the fact that the system is not isolated and forces from outside will act upon it. With regards to kinetic energy, the total energy must also remain constant throughout the collision, however calculations won't take into account the kinetic energy converted to other forms of energy, like heat energy. Despite the fact that the metal spheres used in this experiment are indeed very hard and very elastic, the collision will not be perfectly elastic but partially elastic, meaning a percentage of the kinetic energy and momentum will be converted during the experiment. Total momentum in any collision does not change, even if the individual momentums do. Momentum is defined as: mass × velocity The kinetic energy is defined as = 1/2 mass x velocity² Momentum has the special property that it is always conserved, even in collisions. Kinetic energy, on the other hand, is not conserved in collisions if they are inelastic Another important idea to grasp deals with projectile motion and the fact that

To investigate a free-falling cone.
Aim: To investigate a free-falling cone. Variables: . Independent Variables: > Mass of the cone: I will change the mass of the cone and observe how this affects the time that the cone takes to reach the ground. 2. Dependent Variables: > Time: The time taken for the cone to freefall to the ground will depend on the mass of the cone. 3. Controlled Variable: > Material: The cone will be made of filter paper because filter paper is already in the shape of a circle and hence very easy to fold into a cone. I will use the same cone throughout my experiment to ensure reliable results. > Height of release: I will release the cone at a height of 1.5 meters. Equipment: . Meter Rule 2. Filter Paper 3. Plasticine 4. Stopwatch 5. Scotch tape 6. Scale Diagram: Method: . Fold the filter paper into the shape of a cone 2. To hold it in place, use scotch tape. 3. Measure the mass of the cone using a scale. 4. Add pieces of plasticine to the scale until the scale reads 4 grams. 5. Place the plasticine inside the cone and adjust it to fit into the cone so that it does not move around while inside the cone. 6. Hold the cone at a height of 1.5 meters above the ground and be ready with the stopwatch to time the freefall of the cone. 7. Release the cone (with the plasticine inside) from the height of 1.5 meters and record how long it takes for the cone to hit the floor. 8.

Thermal Properties of Liquids
Investigating the Thermal Properties of Liquids In this experiment I looked at liquids of different densities and whether or not this affected their heating rate. For my experiment I had a variety of common liquids (water, salt water, oil, milk etc.) and measured the density of each before heating them under a Bunsen flame for 2 minutes and recording the temperature change. The purpose of this experiment was to find out what effect the density of a liquid has on it's thermal capacity. Thus I hypothesize that the greater the density of a liquid, the greater the heat capacity. This means that it will take more energy to raise the temperature of the liquid/substance by 1?C and so the lower the heating rate of the liquid. In summary, I hypothesize that the relation between a liquid's density and its heating rate is inversely proportional. Since I will be using five different liquids/substances (water, milk, pepsi, salt solution and sunflower oil) with varying densities, this will be my independent variable. The density of a liquid is defined as its mass per unit volume. The term 'per' in mathematic is defined as a division and the density of any liquid is measured in cubic centimetres (cc) and is equal to 1 mL. To have an accurate and precise density of each liquid, I will be using an electronic scale and all liquids/substances will be weighted beforehand commencing any trial
Physics lab on calculation of copper density using different equipment
PHYSICS LABS-2 In this experiment I calculated the density of copper, using my knowledge of the propagation of errors I was able to arrive on a fairly accurate answer. The primary objective of this experiment was to use our prior knowledge of uncertainties to come to the most accurate conclusion to the density of the metal in the given wire. My research question was to estimate the density of the metal in the particular wire. I was given a small piece of copper wire, string, a micrometer screw gauge, a ruler, a weighing balance. The theory behind this was that, using the given instruments we could calculate the diameter, weight and length of the wire. This in turn would give me the density. I started the experiment by measuring the diameter of the wire, using the micrometer screw gauge. Before starting the measurement I checked for an error in the screw gauge. My gauge had a 0.002 cm positive error, which I had to subtract from my readings. I put the wire in the clamp of the gauge and tightened it, then I took note of the reading on the circular scale. I repeated this four more times (to get an accurate answer), then subtracted 0.002cm from each of the reading and then took an average of all the readings giving me the true value of the diameter of the wire. The error in this case is half of the least count. Since the LC of the screw gauge is 0.001cm the error is +/-
Does the acceleration of a D.C (dynamic car) depend on the ramps angle?
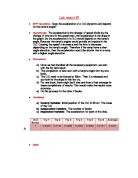
Lab report #1 * MYP Question: Does the acceleration of a D.C (dynamic car) depend on the ramp's angle? * Hypothesis: The acceleration is the change of speed divide by the change of time and in this experiment, the acceleration is the slope in the graph. So the acceleration of a D.C would depend on the ramp's angle. Because the ramp's angles would provide an impulse in the D.C. Causing the speed to increase and the time to decrease depending on the ramp's angle. Therefore if the ramp have a short angle elevation, then the acceleration would be shorter that in a ramp with a higher angle elevation. * Procedure: a) Once we had installed all the necessary equipment, we start with the fist data result. b) The compilation of data start with a ramp's angle form by one book. c) The D.C need to be located at 50cm. Then it is released and you look for the slope in this first try. d) For one book, there might be 6 tries and then a final average for these compilations of results. This would make the results more accuracy. e) Do this process for the other 2 books. * Variables: a) Control Variable: Initial position of the D.C in 50 cm. The mass of the D.C b) Independent Variable: The number of books c) Dependent Variable: The acceleration for each of the tries. * Data: A ms-2 # of Books Try 1 Try 2 Try 3 Try 4 Try 5 Try 6 Average 0.3325 0.3143 0.3289 0.3283
Investigating How The Index Of Refraction Is Affected By Different Temperatures Of Water
Investigating How The Index Of Refraction Is Affected By Different Temperatures Of Water Purpose The purpose of this lab is figure out how the different substances in which we are experimenting affect the index of refraction. In our experiment, we will make 3 replications of regular tap water at (36 °C), hot water at (63 °C) and cold water at (4.5°C) change in the index of refraction. Hypothesis My hypothesis for this lab was, that the boiling water would have the highest index of refraction. Therefore the ice water would have the lowest. My predictions are based on my climate knowledge where I know that warmer an object gets its molecules move faster. And I believe faster moving molecules is more likely to achieve higher index of refraction. Variables Independent variable: The independent variables that we will be using in this lab are the different temperatures of water that are being pored into the Plexiglas then be placed in front of the light source. Dependant variable: We will be measuring the index of refraction for each of the treatments in this lab which will be our dependant variable. Controlled variables: The controlled variables in our lab are the following: 1. The same light source from the ray box for each replication. 2. The controlled amount of water that is poured in the Plexiglas. 3. Same converging lens for each replication 4. All of the