The population is older than ever before due to life expectancy being at an all time high. This means that there are many older people involved in exercise. It has been stated that leading causes of death are related to lifestyle, therefore many take up exercise in a belief it will keep them healthier for longer. This is because exercise helps keeps the body healthier and younger. The main physiological factors of exercise on ageing are that exercise gives an individual improved pulmonary functioning, improved cardiovascular functioning, maintenance of strength and hypertrophy, reduced risk of cardiovascular diseases, reduced risk of injury, and an increased ability to perform routine tasks in daily life. (Davis et al) Exercise also helps the body fight off diseases such as heart disease, diabetes, insulin resistance, and some cancers. Strength training is very popular amongst older people as it helps prevent bone loss, which reduces the risk of fractures. (Brooks et al)
As many older people or people pushing towards middle age know that lifestyle can relate to early death, it can be said that older people have more reason to exercise than younger people. This leads to the second hypothesis in this study which is, ‘Older people will visit the health club more.’
The final hypothesis in this study researched in to self image and depression.
In a culture pre occupied with physical appearance, mainly due to the media, self image has become of huge importance. Self image normally involves three concepts that an individual has of themselves. They are, the image you have of the way you look, how much you value yourself, and what you wish you were really like. Self image is the description you would give of the person that you know you are. (Davenport 1995) Another important factor of self image is an individual’s body image. This links in to the reasons why people go to a health club, as many visit them to improve their body image. Another factor affecting someone’s self image is what people say to us, and the way people react to us.
Depression is a clinical observation and is one of the most common mood disturbances in all individuals. (Rosenburg 1965) Many people suffer from depression. It is caused by an imbalance of chemicals, and it is not something that can be cured at the click of a finger. Millions of people have depression, and the economic cost of depression is estimated at around 20 billion English sterling, but the cost of human suffering cannot be estimated.
There is a link between exercise and depression, where research suggests that exercise effectively reduces depression. In a study run by La Fontaine, Di Lorenzo, Frensch, Stucky-Ropp, Bargmen, and Mcdonald (1992) they found exercise to be such an effective anti depressant that they quoted ‘If exercise could be packed into a pill it would be the single most widely prescribed and beneficial medicine in the nation.’ This information may show up in the results, in a form such as the more times an individual visits the health club, the less depressed they are.
As well as links between depression and exercise, there are said to be links between self-image and depression. It is true that even mild depression can cause a reduction in self esteem, and therefore self-image. It can also be said that if someone has a high self-image, they are likely to have a low level of depression. This is what leads us into the studies final hypothesis which is ‘There will be a relationship between self-image and depression.’
Method
The first measurements recorded were the heights and weight of the sixty participants. The participant’s weights were measured on an accurate pair of scales. The units used were kilograms. After their weight had been recorded, their height was taken. This was done using a height measuring scale which was connected to the wall. The units used for the participant’s height was metres and centimetres.
After this, each participant’s fitness was measured. This was done by obtaining all of the participants vo2 max. This was performed by having the participant’s do the cooper’s twelve minute run. This was performed on a 400 metre running track. The idea was for each participant to run as fast as they could for twelve continuous minutes around the track. After the twelve minutes was up, the distance ran was measured. This could then be put into an equation and used to calculate the participant’s vo2 max. The equation used to work this out was (distance covered – 504.9 / 44.73.) The cooper’s twelve minute run is a reliable test as long as the participant’s run to their maximum, the track is of correct distance, and the stopwatch is reliable. All of this was ensured before the test.
Another measurement that had to be taken for this study was the amount of times the participant’s visited the health club. This was recorded in the form of a tally chart, where each participant had a mark next to their name each time they visited the health club. The sixty participants’ were set up into young and old categories in order to see if one of the hypothesis’s was correct. Out of the sixty participant’s, 32 were in the old category, and 28 were in the young category.
The next factor measured was each participant’s depression level. This was done using Goldberg’s depression test. In this test there are eighteen statements where the participant had to answer with one of five options which were, not at all, only slightly, partly, quite a lot, a lot, and to a great extent. An example of one of the statements is ‘I feel like a failure.’ Once all the statements had been answered with a response, a score out of ten was given to each participant.
Self-image was the final factor to be measured. This was done by using the Egoschool self awareness test. This involved twelve pairs of statements being from one extreme to another, with a scale of eight in between. An example of one of the pairs of statements was I am not self confident at one end of the scale, and I am self confident at the other end. Once all statements had been answered each participant was given a score out of 100.
Results
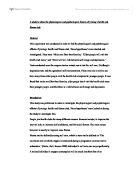
Table 1 – table to show all data collected
The table above shows all the data collected for this study. The table shows the number of participant’s, the minimum unit, maximum unit, the mean and standard deviation for each factor. The mean can be defined as the average value. The standard deviation shows the measure of spread about the mean. For example, where there is a standard deviation of 8.159 for the age of participants, this means that most of the participants will fall either is 8.159 years older or younger than the mean age. The figure of participants in this category is will usually be two thirds of all participants.
Now that all the results can be seen in this table, they can be split up into different sections to see if the three hypotheses’s originally looked at can be backed up.
First hypothesis – Males will be fitter than females
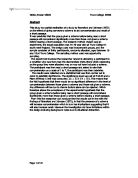
Graph 1 – A graph to show the means of the participant’s original vo2 max and the vo2 max took after six months of health club membership for males and females.
The graph shows the mean figures for male and female vo2 max before and after being a member at the health club. Before joining the health club, males had an average vo2 max of 58.67, whereas females had an average vo2 max of 47.93. After being a member at the health club for six months, males had a vo2 max of 63.90 and females had an average vo2 max of 50.13. Not shown on the graphs is the standard deviation for each gender group. The standard deviations were 9.178, 7.839, 7.703, and 8.089 respectively to the graph from left to right. This shows, particularly during the first vo2 max test, that the standard deviation was larger for the males. This shows that the results for males were more spread out than that of females, meaning that not all males will be fitter than females, as many males will have been quite a lot lower than the mean.
Also performed was a t test which measures the significance of the results. The value of t = 4.871 when tested against a significance level of p = 0.05 gives a critical value of 2.0021. This shows that t is greater than the critical value at a level of 0.05 significance. This means that the null hypothesis that males have the same fitness levels as females is rejected. Instead, the alternative hypothesis is accepted that males are fitter than females.
Second hypothesis – Older people will visit the health club more than younger people.
Table 2 – This table shows the amount of visits made by the old and the young.
The table shows that the mean club visits for older people is higher than that of younger people, with figures of 5.56 and 4.61 respectively. However, the older people have a higher standard deviation than younger people. This means that many young people will have visited the health club more than the older people due to their results being less spread about the mean than that of the older people.
Like for the last hypothesis, a t test was also conducted for these figures. A result of t = -1.313 was returned. As this is a negative value, an alternative hypothesis of older people visit the health club more than younger people was given. This value was tested against a significance of p = 0.05. The critical value of 2.0021 was given. As -1.313 is less than 2.0021, the alternative hypothesis is rejected. This means that the null hypothesis is accepted which is there was no difference in the number of visits between younger and older people.
Third Hypothesis – There will be a relationship between self-image and depression.
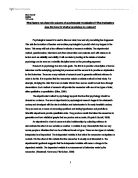
Graph 2 – This scatter-graph shows the link between self-image and depression
Graph 2 shows that there is a link between self-image and depression. The graph appears to show that the higher an individual’s self-image is, the higher their depression is. This is due to a Pearson’s correlation level of 0.95. This is a near perfect positive correlation. This result seems strange, however that will be looked at in the discussion.
Discussion
The results that were found in this study were certainly interesting with some backing up the hypothesis and others contradicting it.
The first hypothesis was males are fitter than females. The results certainly proved that this is the case. The mean vo2 max for males was higher than that of females. Also, the t test result proved for certain that the hypothesis was correct as the alternative hypothesis that males would be fitter than females was accepted. These results backed up what was expected, as all information looked at in the introduction stated that males were physiologically superior to females.
The second hypothesis looked at was older people will visit the health club more than younger people. Although the mean visits for older people was higher than that for younger people, the t test showed that there was actually no significant difference in the amount of visits for each age group. In the introduction, the benefits of exercise for older people were looked at. This made the suggestion that older people would see the need to go to the health club more than younger people. However, what weren’t looked at were the general benefits that exercise has for everyone. With exercise being extremely well documented in the media, it is maybe no surprise that all age groups are visiting the health club. Another fact clearly stated in the introduction was that as you grow older, your general fitness declines. Also stated was the fact that older people take longer to recover from exercise than younger people. Due to this, it is maybe a surprise that younger people did not visit the health club more than older people.
The final hypothesis looked at was, there will be a link between self-image and depression. The results obtained in this section were certainly strange. This is because when Pearson’s correlation was looked at, a near perfect positive correlation was found. This was strange as it suggested that the higher ones self-image is, the higher their depression level will be. This backs up the hypothesis by showing that there is a link between the two, but it is certainly not the result that was expected. This could be to do with bad calculations in the results, or incorrect method of testing. This needs to be studied again to ensure these results were correct, as they certainly were weird results.
Conclusion
The study as a whole went well, with some interesting findings. After the results section, it was found that males were fitter than females. It was also found that there is a link between self-image and depression. The final finding was that the results suggested that older people didn’t necessarily visit the health club more.
If the study was to be repeated again, there are some ways in which it could be improved. One way it could have been improved would have been to do different or more self-image and depression tests. It is believed that the results found didn’t appear to make sense, so more tests should be done to see if the results were actually correct. Another way to improve the study would have been to have more people in the study. Although sixty was a high enough number of participants, even more participants would have made the results found in the study even more conclusive. A final way that would have made the study more conclusive would have been by having more than one fitness test. There is many more fitness test which finds an individual’s vo2 max. These include the multistage fitness test and the Harvard step test. If one more test had been done, it would have confirmed that the vo2 max figure
found was correct. Overall, however, the study can be classes as a success with some interesting findings.
References
Brooks.G.A, Fahey.T.D, White.T.P, Baldwin.K.M (2000) Exercise Physiology: Human Bioenergetics and its Applications. 3rd Ed. New York, Mcgraw-Hill. (P 7, 321, 323-333, 783-793)
Cox.R.H (1998) Sport Psychology: Concepts and Applications. 4th Ed. USA. Mcgraw-Hill (p341-344)
Davenport. G.C, (1996) Introducing GCSE Psychology. London, Collins Educational (p73)
Davis.B, Bull.R, Roscoe.J, Roscoe.D (2003) Physical Education and The Study of Sport. 4th Ed. London. Harcourt Publishers (p 185-189, 108, 278)
Hinton.P.R (1998) Statistics Explained: A Guide for Social Science Students. New York, Routledge (p 7,65-66)
Stroebe. W (2001) Introduction to Social Psychology. Oxford, Blackwell Publishing Ltd (p 146-147, 228-234)
Word count - 3045