These findings are some what supported by the findings of Trankle, Gelau and Metker's (l990) from their journal article: Risk Perception and Age-Specific accidents of Young Drivers, in which they claimed that young male driver are more likely to take risks that lead to accidents than older male driver. Trankle et al. (1990) conducted their study with 308 participants in total of which 208 were male participants and 100 female participants, with an age range from 18 to 75 years. These participants were asked to watch 100 slide-presentations of traffic situations and indicate level of risk. Trankle et al. (1990) found that young males between the ages of 18 and 21 were more likely to report lower levels of risk than middle-aged males between the ages of 35 and 45. However, no significant difference was found in females. In discussing their findings Trankle et al. (1990) stated that ratings of young females risk rating were fairly consistent to those of other females of different age groups, however they rated higher than the males. Showing that men are less likely to recognize a risk than their female counterparts.
A recent study also found a similar trend. Begg and Langley (2001) conducted a study to determine whether the frequency of risky driving behaviour changed between the ages of 21 and 26 years. 936 participants were tested using face-to-face interviews, using a structured questionnaire that included items on a range of risky driving and thrill-seeking activities. The results show that risky driving was largely a male activity, but by 26 yrs of age, many had "matured out" of the behaviour. However the desire for thrill-seeking carried on to increase among the males. Within females, there were not many significant changes between the ages of 21 and 26 yrs, results shoed that across both ages, the prevalence of risky driving and
thrill-seeking was relatively low, compared to male drivers. Taking into consideration all the above research an investigation was carried out to find out whether males caused more accidents than females and whether this is as a result of men’s participation in risky driving behaviour (speeding).
Aim
The aim of the investigation was to find out whether males cause more road accidents than
females and if the speed at which they are driving plays an important factor in this difference.
Method.
The investigation was carried out on statistics taken from The Australian Transport Safety bureau. (Fatal Road crash data base). This is an official Australian statistic website, therefore the data can be accepted as fairly reliable. The data was found by doing a search on the net for data on road crashes caused by males and females. The data consisted of number of accidents (fatal crashes) caused by males and females across 12 years from 1989 - 2000. The data also contained information regarding the speed at which the driver was driving. The speeds ranged from 10 miles per hour to 110 miles per hour. An analysis was carried out using speed at which one was driving and gender as independent variables and the number of accidents caused as dependent variables.
The data was entered into spss and some of the data was characterized into groups the first category was that between males and females. The speeds were also put into categories where speed from 10-40 miles per hour were put in the first group speeds from 50-70 were put in the second category and 80-110 were in the third category. The data was then subjected to a non-parametric correlation (Pearson’s r). All variables speed, number of accidents and the gender were analyzed together. As a difference between males and females for accidents and speed was not found, the numbers of accidents for each year were analyzed separately. This was done to see if a trend could be found within the different years as the standard deviation was so high (as some years had far more accidents than others). By analyzing each year separately it was thought that the gender difference may be found in certain years.
Results
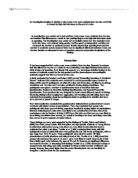
The mean number of accidents caused by males and females can be viewed in table 1. By looking at the means there seems to be a great difference between males and females in the number of accidents caused by them. The standard deviations of the two also differ a great deal.
Table 1: Descriptive statistics for both males and females.
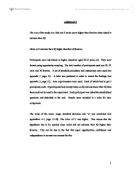
The results of the spearman’s rho correlations showed that when speed, number of accidents and gender were entered together, a positive correlation was found between number of accidents and speed; (rho= .834, n= 26, p =0.001). However when looking at the relationship between number of accidents caused and gender no significant correlation was found; (rho =.170, n=26, p >.005). A graph was also drawn up of all the findings (Graph 1) from the graph it also appears as if the hypothesis is being supported. As the graph shows that as the sped goes up so do the number of accidents and that this is higher for males.
Graph 1: Graph showing the number of accidents caused by males and females,
depending on the speed they were driving.
This correlation analysis was also carried out on the data for each yearindividually. All years found the same correlation between numbers of accidents and sped however no gender difference was found. Table 2 contains all the correlation for each year.
Table 2: Correlations for each year.
Discussion
The investigation was aiming to find that males have more road accidents than females and that this was because they engaged in more risky behaviors. Analysis of the data found that there is a positive significant correlation between the speed at which one is driving and the number of accidents caused. However no correlation was found between gender and number of accidents caused. For this reason it was not possible to reject the null hypothesis concluding that in this investigation there was no difference in the number of accidents caused by males and females, the effect of speed did have an effect on the number of accidents however this was not greater for males.
Even though the mean scores and the graph plot suggested that there was a difference this difference was not found significant, this could have been due to the very large standard deviation found in the results of the males. Future investigations could use more data to try and solve this problem.
Also as the data was taken from a small sample and taken only from one country, whereas previous research may have been taken from various countries, the data used in this study may be limited. Further explanations as to why the desired results were not found could be due to the fact that more women have started to drive. Pokin, Rudisill, and Waller (1988) suggested that historically men have driven more than women, and that this trend is slowly changing with the times, they also claimed that as the number of licensed women drivers are increasing this could possibly change the statistics of convicted number of males and females (on causing accidents). As males historically drive more, this may account for the greater number of driving accidents for males. This bias could be present in the data used for this investigation, and may explain why a different was not found. The findings of Begg et al (2001) could also shed some light on why such results were found. Begg at al found in their study that as men grow older (after the age of 26) they ‘mature out’ of risky behavior, as the ages were not taken into consideration in this study it may be the case that all the data was taken from older drivers. Future modifications could include using age as an extra variable. In order to improve the investigation a lot more variables could be included in the analysis, as mentioned above age, also in order to measure risky behavior more accurately the weather conditions at the time of the experiment could be investigated. According to Marc Green (2004) rain reduces driver perception in several ways; it both directly affects perception (seeing through rain) but also produces visibility changes through its action on headlamps, windshields, the road itself and road markings. The poor visibility usually causes people to concentrate their attention directly ahead in order to see where they are going. Which then decreases the probability of seeing with the ‘peripheral field’, and so the driver for example would find it harder to see a car or pedestrian approaching from the side. As bad weather conditions usually result in higher risk behaviors, compared to under normal conditions using this as a variable would prove beneficial, in trying to find a difference between genders, by looking at who caused more accidents when the weather is bad and why this is the case. Over all a lot more work needs to be done on this investigation, by adding all the suggested modifications, the results should present a clearer picture of whether there really is a gender difference and also why such difference occurs. Practical implication for such findings
Reference
Begg, D, Langley, J (2001) Changes in risky driving behaviour from age 21 to 26 years.
Journal of Safety Research. Vol 32(4) Win 2001, Elsevier Science, US.491-499,
Furnham, A. and Saipe, J. 1993. Personality Correlates of Convicted Drivers. Personality, Individual Differences, Vol. 14, No. 2, pp. 329-336.
Green, M. Contrast detection and direction discrimination of drifting gratings. Vision Research, 23, 281-289.
Pokin, C.L., Rudisill, L.C., and Waller, P.F. 1988. Female Drinking and Driving: Recent Trends in North Carolina. Journal of Accident, Analysis and Prevention, Vol. 20, No. 3, pp. 219-225.
Trankle, U., Gelau, C., and Metker, T. 1900. Risk Perception and Age-Specific Accidents of Young Drivers. Journal of Accident, Analysis and Prevention, Vol. 22, No. 2, pp. 119-125.
Raw data can be found in appendix 1.
All output can be found in appendix 1
All data for individual years can be found in Appendix 1.