The participants often made incorrect responses and 6 out of 12 trails 76% of the time the true partaker went along with the group on at least one trail. Under controlled conditions when the confederates answered correctly only 5% of the participants made an error. This however, tells us that although group pressure didn’t affect the participant’s perception, it did indeed affect their behaviour.
An earlier study conducted by Sherif (1935) used a visual illusion to detect conformity, this was known as “The Auto Kinetic Effect” this is a stationary light in a dark room appears to move. Sherif told his participants that he was going to move the light and he wanted them to tell him how far they perceived the light to move. They were first tested individually and were asked to estimate the extent of the movement several times. There was a wide difference of estimates between the individuals, they were then presented with each others estimates and this was to represent a group situation. Under these conditions the estimates of different participants converged and a group norm developed. According to Sherif the participants in their groups used the other estimates as a frame of reference. This was refuted by Asch as he stated that Sherif’s task was ambiguous and had no right or wrong answers which made it difficult to draw conclusions on conformity. Conformity will be widely researched by many psychologists and many different argues will be presented. Throughout this study we hope that we can tell if conformity is such an issue in today’s society.
Our investigation will try to establish if general members of the public will conform to social deviancy. In this we will instigate a crossing at a pedestrian crossing whilst the green light/ red man are in operation, we will try and find how many, if any, males, females and groups will cross when the instigator does, thus deviating from the social norm of society.
H – At a pedestrian crossing people are more likely to deviate from the norm when one or more persons instigate a crossing on a green light/ red man.
H – At a pedestrian crossing people are not as likely to deviate from the norm when one or more persons instigate a crossing on a green light/ red man.
Methodology
Participants:
The Participants that were used to conduct this experiment was that of a group of unsuspecting pedestrians, all pedestrians involved were of different race, age and gender. 33 males and 34 females.
Materials:
The resources that were applied for this investigation were pedestrians, pen and paper, traffic and the traffic lights. A computer was then made use of to record the data collected so the results could be analysed.
Procedure:
The study was carried out by a small sample of psychology students at the University of Ulster, Magee who were trying to establish if ordinary members of the public would conform to social deviancy. They decided to perform the task of crossing the road whilst the green light/red man was in operation, in doing this they wanted to establish how many, if any, members of the general public would conform to such deviancy. They also wanted to ascertain if the majority to conform would be male or female and if there was a difference in the age groups. The students went to certain pedestrian crossings throughout the town and proceeded to cross the road on the green light/red man, they then recorded how many people crossed with them, their gender and their sex. This was then transferred onto SPSS to analyse the results.
Oneway
Descriptives
Followed
Fig 1
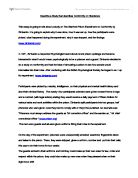
As we can see from the table the mean of males was much higher than the females and the group mean is higher than both, however the SD for all are very similar.
Test of Homogeneity of Variance
Followed
Fig 2
The homogeneity table is the assumption for Anova here we can see, Lev. (2, 97) = 3.038 p>.05 therefore the results are significant. The significant was .52 so this tells us to interpret with caution.
Anova
Followed
Fig 3
The Anova table tells us that F (2, 97) = 41.544 p<.05 the significant difference in all is p<.05 therefore the null hypothesis can be rejected.
Post Hoc Tests
Multiple Comparisons
Dependant Variable: Followed
Bonferroni
- The mean difference is significant at the .05 level.
Fig 4
Means Plots
5.0
4.5
4.0
3.5
3.0
2.5
2.0
Male female group
Fig5
The means plots diagram explains that again the male is higher than the female and the group is significantly higher than both.
Results
The data that was collected during the study was that of nominal data and of independent measures. This data was then analysed using SPSS which was interpreted through various tables. Firstly the use of a desciptives table was used to measure the mean and standard deviation of the population used. It can be seen that the mean scores were higher for males (3.000) than the females (2.2059) and the group means were higher than both (4.6667). However, the Standard Deviation was similar for all.
We further investigated with a test of homogeneity of variance; this test is an assumption of ANOVA. With our findings we were able to establish the Lev. (2, 97) =3.038 p>.05 so therefore our results are significant, however the significant value was .52 and this told us to interpret the results with caution.
The ANOVA table told us that F (2, 97)=41.544 p<.05 and the significant difference in all is p<.05 therefore we reject the null hypothesis. Finally the use of a means plots diagram explained and highlighted the results further
Discussion
We have observed from our investigation that our findings revealed that there is not a significant difference. We were able to establish this using the Anova table were the F=41.544 P< .000 as we are using the .05 level this told us that it was not significant, so we accepted the hypothesis and rejected the null. The hypothesis of the study was to ascertain if people would deviate from the norm when one or more people instigate crossing the road whilst there is a green light/red man.
There are many factors that have attributed to our results and the outcome could have been proved different as only small samples of participants were used in the study. Other extraneous circumstances may have altered the results these were due to the fact of weather conditions and traffic flow. The study could have improved, if a larger sample had of been used and also if there was less traffic on the roads, i.e. quieter times of the day and Sundays.
References
Asch,S.E. (1951). Effects of group pressure upon the modification and distortion of judgement. In H. Guetzkow (ed.) Groups, leadership and men. Pittsburg, PA: Carnegie Press.
Asch, S.E. (1955). Opinions and social pressure. Scientific American, pp 31-35.
Gross, R. (1996). The Science of Mind and Behaviour. 3rd ed. Hodder and Stoughton.