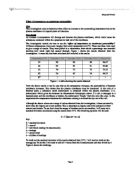
Figure 2: A table showing the calculation of the average.
I will now need to minus the % transmission from the average. From the result I can square it to work the (x-x)².
Figure 3: A table showing the calculation of the %transmission and the average being squared.
Now that I have the figures for the above part of the equation I can now work out the figure for the below part of the equation. To do that I will need to minus the number of readings by 1 which is: 3-1 = 2.
I will now work out the ∑. To do this I will need to add the values from the (x-x)²:
0.45 + 0.11 + 0.11 = 0.67
I will now divide the above value by 2
0.67 / 2 = 0.335
To finish the equation I need to now square route 0.335
√0.335 = 0.56
The standard deviation for 53˚C is 0.56. This value is less than 10% of the mean (7.33%). This indicates that the result obtained from this temperature is reliable. The following table shows the standard deviation for the rest of the temperatures.
Figure 4: A table showing the calculation for standard deviation for all the temperatures.
As it can be seen from figure 1 there are only one set of results that are not reliable. Those are the results obtained from 65°C. As it is not reliable it may cause some anomalies. This will be explained fully later.
A graph will be drawn to show the relationship between the temperatures on beetroot plant cell and the permeability of the membrane. The graph will be labelled as appendix 1.
Referring to the graph, there is visually a relationship between the change in temperature on beetroot plant cell and permeability of the membrane. As predicted before, as the temperature increases, the permeability of beetroot membrane increases. To prove this theory I will mark on the graph two random temperatures and see whether the percentage transmission either increases or decreases with them. Please refer to the graph for this demonstration.
The two temperatures chosen were 55°C and 75°C and the percentage transmission numbers on the y axis showed 69% and 25%. The permeability of the beetroot membrane does depend on the temperature that it is placed in. Choosing a random temperature shows that the higher the temperature the more permeable the membrane, thus the more dye bleeds out of the membrane. The following will now outline an explanation of the above theory by referring to the cell membrane structure, diagrams and references will be used from the books listed on the cover of the coursework page.
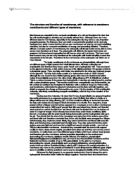
After collecting and correlating the results, I have come to the conclusion that the experimental hypothesis is correct, in that an increase in temperature will damage and denature the plasma membrane and cause the cytoplasm and other substances contained within the membrane to leak out. This has been shown by the steady increase in anthocyanin leaked out of plant cells as the temperature increases. A description of the plant cell’s membrane structure will be given to show how temperature affects its structure. Figure 5 is a diagram of a typical cell membrane.
Figure 5: A diagram showing the plasma membrane of a cell.
The cell membrane (or plasma membrane) surrounds all living cells. It controls how substances can move in and out of the cell and is also responsible for many other properties of the cell. The membranes that surround the nucleus and other organelles are almost identical to the cell membrane. Membranes are composed of phospholipids, proteins and carbohydrates arranged in a fluid mosaic structure, as shown in the above diagram. The phospholipids form a thin, flexible sheet, while the proteins "float" in the phospholipid sheet like icebergs, and the carbohydrates extend out from the proteins.
The phospholipids are arranged in a bilayer, with their polar, hydrophilic phosphate heads facing outwards, and their non-polar, hydrophobic fatty acid tails facing each other in the middle of the bilayer. This hydrophobic layer acts as a barrier to all but the smallest molecules, effectively isolating the two sides of the membrane. The following will show a picture of the structure of phospholipid.
Another important part of the membrane is the protein. Proteins are made from amino acids which are attached to different ‘R’ groups from which each one gets its characteristic. There are 20 different R groups. These R groups are responsible for the three dimensional shapes of protein molecules hence their functions. Proteins contain many bonds which gives it a stable globular tertiary structure. The bonds that protein contains are: hydrogen bonds, disulphide bonds, ionic bonds and hydrophobic interactions between the R groups. There are a variety of functions that proteins do within a cell membrane. The proteins usually span from one side of the phospholipid bilayer to the other (intrinsic proteins), but can also sit on one of the surfaces (extrinsic proteins). They can slide around the membrane very quickly and collide with each other, but can never flip from one side to the other. The proteins have hydrophilic amino acids in contact with the water on the outside of membranes, and hydrophobic amino acids in contact with the fatty chains inside the membrane. Proteins comprise about 50% of the mass of membranes, and are responsible for most of the membrane's properties.
As this investigation looks at how the change in temperature affects the permeability of the beetroot cell membrane, I will concentrate on that area. As explained above, there are chemical bonds present within the cell membrane. These chemical bonds can be disrupted by either a change in pH or temperature. The proteins react with the substrates outside and inside the membrane through energy. When energy is given to protein (kinetic energy) the number of interactions with the substrates start to increase and therefore the number of collisions between the two increases. The protein has an active site to where the substrate binds onto. There is a relationship between temperature and the theory of collisions which relates to the structure of the cell membrane. It is said in ‘Biology 1’, endorsed by OCR pg 47, that “as temperature continues to increase, the speed of movement of the substrate and enzyme molecules also continues to increase. However, above a certain temperature the structure of the enzyme (protein) molecule so energetically that some of the bonds holding the enzyme molecule in its shape begin to break. This is especially true of hydrogen bonds.” From the investigation, the temperature from 23°C to 87°C was increasing the kinetic energy given to the protein within the cell membrane of the beetroot. From 23°C to 87°C it can be seen that the permeability of the cell membrane increases. This could be due to the fact that the chemical bonds within the protein, that control which ions pass through the bilayer, become disrupted and eventually break as the temperature increases allowing the anthocyanin to diffuse out . As the chemical bonds begin to break the protein becomes denatured as it is not able to carry out its normal functions. Although the temperature affects how an enzyme works, there is a range of temperatures that it works best at. This is referred to as its optimum temperature. Any temperature above that optimum number will denature the protein. Referring to the results collected it can seen that this theory is correct. A plant cell’s optimum temperature is about 38-40°C. At this temperature the proteins work efficiently. From the graph, it can be seen that the beetroots optimum temperature was at 23°C. This was the temperature that gave 3 results nearest to 100% light transmission. From 45°C to 87°C the proteins may have become denatured affecting the permeability of the membrane itself. However, this does not mean that all of the beetroot placed in the different temperatures could have all had the same side effect to the particular temperature. From 23°C to 45°C, the light % transmission does not decrease rapidly; the figures do not differ greatly. This could be due to the number of proteins being less denatured in 45°C as I would expect it to be, as this temperature would be considered above the optimum temperature that the plant cell could survive within.
The betacyanin pigment of beet roots is normally sequestered in the vacuole and, by means of the properties of the tonoplast and cell membrane, does not leak into the cytosol or the extra-cellular sap of the beet root. Of course if the beet root is cut, cells are sliced open and the pigment spills out, but if the membrane is altered (phospholipid bilayer + proteins) more subtly leakage (diffusion) of betacyanin is induced.
Although, the results help explain the hypothesis they may not be entirely reliable. Three readings were taken to increase accuracy; however this does not mean that the three results were accurate. Limitations in the apparatus could have encouraged this to occur, for example the standard deviation calculation for 65 C shows that the results are not reliable. There is also an anomalous result for 45 C. This is circled on the graph. The reason for the anomalous result could be due to a number of factors which will be discussed further in the evaluation.