The dependent variable was the time taken by the participants to complete the visual task. It was to measure the time taken for the visual task. Numbers of correct answers in both tasks were neglected, and the participants were not requested to complete the same number of calculations. Time was taken in seconds.
Visual task for both conditions contained same number of word. Half of them were neutral to color and number. Word order was randomized. Color words in condition 1 were replaced by numbers in condition 2 in exact position. The mathematical questions were in exact order for all participants, and the questions were asked immediate after the previous one was answered.
Participants
6 of the participants were my friends, whom I had given verbal invitation to. The 20 participants rest were adapted from the Method Booklet 3, DSE 212 Exploring Psychology from The Open University. The 6 recruited participants had no knowledge about psychology, and they did never participated in a similar test. The age of all 20 participants were ranged from 18 to 56, 11 were female, 9 were male. The 6 recruited participants were university graduates, who had no problem about the English words presented.
Materials
For the visual task, paper containing 36 words, ordered in two columns, was prepared for each condition. 18 of the words were animal names; the 18 words left were color names for condition 1 and numbers for condition 2. Those words were in random order while the animal names were in the same position for both conditions. On the right side of each word, there was a rectangular box for participants to place a tick. Samples for the two conditions are provided in Appendix 1. For the auditory task, 24 mathematics questions were prepared as provided in Appendix 2. Those were simple additions, subtractions or multiplications. A response sheet was used to collect the information about age, sex, condition and response time, as provided in Appendix 3.
Procedure
The experiment was carried in a quiet environment individually. The participants were asked to sit down and calm down in front of a table before the briefing start. The question sheet for visual task was then place on the table with printed side facing down. In the briefing, the participant was told to complete two tasks simultaneously. Two columns of words were printed on the flipped sheet. First task was to place a tick to some of the words by its nature: color names for participates of condition 1, and numbers for condition 2. They were told to complete the left column before the right column, from the top to the bottom. The second task to be completed at the same time was to answer a series of simple mathematical questions, which no single question could be skipped. They were asked to say “completed” as long as they completed the visual task.
After confirming that the participants understood the instruction clearly, they were asked to flip over the sheet and start ticking the appropriate box on the sheet. The first mathematics question was asked immediately after they flipped the paper and time was started to count. The mathematics questions were asked one by one immediately after the previous was answered. Timing was stopped as soon as they said “Completed”. The time, condition, participants’ sex and age were recorded on the response sheet.
Result
The experimental hypothesis tested in this experiment was that participants will take longer to complete two tasks that require similar responses than two tasks that require dissimilar responses. The time taken for each participant to complete the experiment was measured to the nearest second. Table 1 showed the mean time for the participants to complete the task in two conditions. It appears that on average participants took less time to complete the two tasks presented in condition 1, which consisted of two tasks required similar responses. However, the value for standard deviation is large (13.3 and 19.9).
Table 1 Mean length of time taken by condition
An independent samples t-test was conducted on these data. The result denied the statistical significance of the data (t=1.003; df=18; p=0.329). Base on the result, the experimental hypothesis was rejected, and hence the null hypothesis was accepted.
Discussion
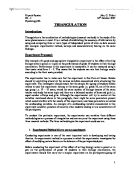
The result of the experiment was failed to prove the experiment hypothesis that participants will take longer to complete two tasks that require similar responses (SRT) than two tasks that require dissimilar responses (DRT). The average time for participants to complete SRT was shorter than that of DRT. Despite the fact that result was inclined to the opposite side, accepting the counter conclusion cannot be justified as the result is not statistically significant. Therefore, we cannot conclude that the brain can respond better to stimuli requiring the different pool than that of same pool of resources; neither can we conclude there was a specific pool of resources for handling numbers.
First, the stimuli the participants responded to seem similar the two tasks used in this experiment may not be using the same pool of resources. In the experiment, a basic assumption was that participants in condition 1 were really handling SRT. However, no prove could be given that the responses of the two task were using different pool of resources, despite that they were both characterized by “number”. Those stimuli may address two separate pools of resources, number and words. In particular, numbers and colors in the both condition of visual task may still be treated by same pool of resources.
Second, the auditory task required calculation. Hence, the intelligence of the participants may be confounding. The time taken for participants to complete the task was depends his calculating ability. From table 1, we can see the standard deviations for both conditions were very large. Therefore, the time taken for the participants dispersed in a large range. Hence, individual difference across participants had a great impact on the accuracy of the data collected and the reliability of the experiment to verify the hypothesis.
Moreover, the time measured in this experiment was dominated by the time used for calculation, rather than the actual response time to cognitively process simultaneously presented information. Therefore, the validity of the experiment could not be justified.
Although the experiment was failed to verify the experimental hypothesis, it demonstrated the capacity of the brain was limited (Kahneman, 1973, cited by Edgar 2002). When performing the calculating task, the participants were delaying their visual task. It was observed that the participants could not place ticks in the boxes when they were calculating as fast as when they were listening in both conditions. Although actual data was not collected on the difference of speed for ticking the boxes when they are listening and calculating, the behavior was clearly observable. Hence, it is clearly that the calculating part of the auditory task irritated the visual task, which demonstrated the limited processing capacity of the brain.
This research has given an idea on how experiment could be carried to refine the study of attention, particularly on the simultaneous stimulus on a specific pool of resources in the brain, regardless the mode of response. In the future, a within participant experiment could be used to minimize the effect of individual differences of intelligence, so as to minimize the effect of the confounding variable. Also, a simpler task, instead of the calculating task should be used, so as to enhance the validity of the experiment. The auditory task could be replaced with simple task like “addition by 1”, to increase the validity.
References
Edgar, G. (2002) ‘Perceptions and attention’, in. Miell, D., Phoenix, A. and Thomas, K. (eds) Mapping Psychology, Milton Keynes, The Open University.
Appendix 1 Word List for Visual Task (Condition 1 and 2)
Appendix 2 Mathematics Question for Auditory Task (for Both Condition 1 and 2)
Appendix 3 Response Sheet
Appendix 4 SPSS Output