A cardboard viewer will be made so that the exact same area of each leaf is examined.
Nettles being examined will all be from the same place (the outside edge) of the cluster to make sure that only one variable is changed and all the nettles have been subjected to the same biotic and abiotic factors.
Safe Test: To make this investigation a safe test, gloves will be used for picking the nettles so as to avoid contact with the skin.
Microscopes being used to examine the nettle leaves will be handled with care so as to avoid breakages.
Method:
- Select field from which samples will be obtained.
- Using rubber gloves, select 10 samples from both types of nettle and place in appropriate labelled bags, making sure they are all the same size.
- Take samples back to work bench and place on microscope with viewfinder on the section of the leaf that is being examined. This will be the middle, underside as it is the clearest part of the leaf.
- Count the number of stingers in that view being careful not to confuse these with the ordinary hairs on the leaf.
To identify a trichome:
- Do this for each of the 20 leaves examined and record each of the results in a suitable table.
- Record the accuracy of your results using a statistical test.
Prediction: The prediction is that the nettles from the cut grassland will have a greater number of trichomes than the nettles from the uncut grassland. This is because, it is suggested that, when a nettle is attacked, the new leaves grow with a greater defence than before (in this case, a greater number of stingers) so as to prevent being attacked again. Nettles that have not been disturbed, will therefore not need to build up this defence and so will not produce any more stingers.
Results:
Comparing the two averages I have calculated it is clear to see that there is over double the number of trichomes on the leaves of nettles grown in the grazed field than on the leaves of the nettles grown in the ungrazed field.
A statistical test will now be carried out on these results to test whether my two sets of results are significantly different.
Hypothesis:
The null hypothesis is that my 2 sets of results will not differ. Therefore the two types of land the nettle leaves were collected from (grazed and ungrazed) have no effect on the number of trichomes on the leaves.
To decide which statistical test to conduct on my results, I answered a Key on a decision chart (see appendix). This concluded that I should conduct the ‘Mann – Whitney U Test’ on my results.
The Mann – Whitney U Test:
The range values were calculated by using the median as a central tendency.
Formula: (Area 1)
U = n1n2 + n1(n1 + 1) - ΣR1 = 20 x 20 + 20(20 + 1) – 604 = 400 + 210 – 604 = 6
- 2
Formula: (Area 2)
U = n1n2 + n2(n2 + 1) - ΣR2 = 20 x 20 + 20(20 +1) – 216 = 400 + 210 – 216 = 394
- 2
n1 = number of nettle leaves picked in ungrazed field n2 = number of nettles picked in grazed field
Looking at the statistical table, the value at the 5% significance level for ‘across 20’ and ‘down 20’ (I am using the number 20 in each case as this is the number of nettles I picked for each field) is 127 (see appendix).
If the lowest value in my results is lower than this number then the null hypothesis is rejected. My lowest value is 6 which is significantly lower than 127 so therefore this means that the null hypothesis is rejected and the alternative hypothesis is accepted. This proves that there is a significant difference between the number of trichomes on nettle leaves grown in grazed and ungrazed fields.
Discussion: My results show that there is a significant difference between the number of trichomes in grazed and ungrazed fields.
The quote “Nettles that have been cut down or grazed show a higher density of stinging trichomes on the leaves of the regrown shoots” (Pullin and Gilbert, 1989) supports my findings. They also suggested that “The stinging nettle (Urtica dioica) increases trichome density after mechanical and herbivore damage”.
The increased density of trichomes were seen in the newly grown leaves and in the case of induced chemical defences, the response was also noticeable in the existing leaves as well.
For my results I obtained two central tendencies (averages). The average I calculated from the data I collected was the mean. To conduct the ‘Mann – Whitney U Test’ I needed to work out the ‘R’ values by calculating the median as a central tendency.
It is suggested that the stinging nettle increases it’s trichome density to reduce its palatability to herbivores, but the same alteration also occurs when the plant is subjected to mechanical damage as well.
Anomalies:
An anomaly that occurred was the number of trichomes on leaf number 15 picked from the ungrazed field.
I only found 5 trichomes on the part of this leaf that I studied. Although this value does not disagree with my hypothesis, it was unusually low compared to the rest of the results obtained. This anomaly could have occurred if the plant was damaged in some way and the stingers were broken off, or were not able to develop properly. To test this idea I could return to the plant that I picked that specific leaf from and pick some more leaves off the same plant. I could then examine these to see if I still obtained the same low result. I would then write a conclusion from this to explain the anomaly.
Sources of error:
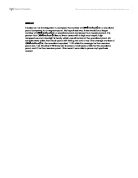
A source of error was the leaf size I collected. At the start of the experiment I produced a template leaf size to match my other leaves to, but it was impossible to collect all the leaves exactly the same size so there was some variance. To overcome this I examined the exact same position on each leaf:
I made sure that on all the leaves I looked at, the view finder I made was placed over the leaf so I could see the main vein and two side veins coming off at either side of the main vein. This made recording the number of trichomes a lot fairer.
As the leaves were 3 dimensional in shape, it was difficult to count the trichomes as they did not all face towards me or were not all perpedicular to the surface of the leaf. By changing the focus on the microscope, different areas of the leaf came into focus so it was easier to count all the trichomes in the section.
I also decided that I would collect 20 leaves for each field type instead of 10 to widen my range of results. Therefore a more accurate average could be obtained and the statistical test I conducted on my results would have a greater validity.
Limitations:
The limitations of the investigation were the time available and sample size. There was a limit to the amount of time I could spend collecting the data and so a sample size of 40 leaves had to be collected. If more time was available, I would have collected a larger number of leaves and therefore my results could have been generalised to an even larger surrounding and not just the two fields in which I collected the data. I tried to expand my results as much as possible by collecting leaves from many different patches in the field.
Another reason for collecting from different patches in the field is due to genetic factors of the plant. Urtica dioica is an asexual plant. Therefore all the nettles in a patch have been reproduced (cloned) from one single plant therefore, the high number of trichomes on the nettle leaves grown in the grazed
field could have been due to a genetic factor within that specific patch of nettles in the field. To overcome this limitation, I tested nettle leaves from different patches of nettles within that field and still obtained the same result.
Further Work:
If I were to conduct this investigation again and had no time limit, I would carry it out throughout the year to take into account the season changes and therefore, see if this had any effect on my results.
I could also look at the variance of trichomes on leaves of nettles in shaded and unshaded parts of just one field.
I could also investigate the difference in the number of trichomes on plants from the outside and the inside of the batch.
I would compare these results to the results I have already obtained, and a more detailed conclusion could be drawn.
Overall, the investigation went according to the planning and a reliable and valid set of results were obtained. These proved that there is a difference between the number of trichomes grown on nettles in grazed and ungrazed fields. This concludes that aboitic factors as well as biotic factors do affect the way a plant develops.
Appendix
Information for theory:
- www.naturepark.com/snettle.htm
- Comparative Plant Ecology
Authors: J.P. Grime, J.G. Hodgson, R. Hunt
Information for Discussion:
- Interactive Learning: An investigation into induced plant defences
Authors: P.J. Wright, R. Bonser
- Decision Chart: A Key to Statistical Tests
Authors: P. Chalmers, P. Parker
- Book on poisonous plants
- Statistic Table