Calculation:
To calculate concentration of 1% eluent fraction, using the formula A = εcl, provided that ε (1%) = 3.5, where A = absorbance, ε = coefficient extinction, c = concentration, l = path length
Concentration of heamoglobin in eluent fraction (1%) in tube 11, g/100mL
By using equation A = εcl,
0.012 = 3.5 x c x 1.0
c =
= 3.429 x 10⁻³ g/100mL
Concentration of heamoglobin in eluent fraction (3%) in tube 11, g/100mL
3.429 x 10⁻³ g/100mL x 3
= 0.0103 g/100ml
Mass of haemoglobin in each eluent fraction (3%) in tube 1, µg/mL
Concentration of haemoglobin = 0.0103 g/100ml
100ml consists of 0.0103 g of haemoglobin,
1ml consists of
= 1.029 x 10⁻⁴ g
Thus, mass of haemoglobin, µg = 1.029 x 10-4 g x 106
= 102.86 µg
Same method of calculation was applied to tube 11 – diluted sample in order to calculate concentration and mass of haemoglobin eluent fraction (3%).
Total mass of haemoglobin recovered in CM column in tube 11 – 20, µg
= 102.86 + 128.57 + 137.14 + 445.71 + 522.86 + 454.29 394.29 + 274.29 + 137.14 + 102.86 = 2700.01 µg
Percentage recovery haemoglobin in CM column, %
= [ ] × 100%
= × 100%
= 68.48 %
Figure 4: Elution profile of haemoglobin mass against diluted sample tube in CM column.
Determination of serum albumin
i) DEAE column
Table 5: Absorbance, A595 of Standard Solution for Serum Albumin in DEAE Column.
Figure 5: Standard curve of absorbance against mass of BSA contained in the solution (µg) in DEAE column.
Table 6: Mass of serum albumin contained in the solution in µg and the absorbance, A595 at DEAE column.
Calculation:
Mass of albumin in 1% eluent fraction is calculated using the equation in the standard curve of DEAE column, y = 0.0197x in which y = absorbance and x = albumin mass
By using equation: y = 0.0197x
Mass of serum albumin in eluent fraction in tube 11, µg
0.032 = 0.0197x
x =
= 1.624 µg/0.1ml
0.1ml consists of 1.624 µg of serum albumin
1ml consists of = 16.24 µg
Concentration of serum albumin in each eluent fraction in tube 11, µg/mL
When the mass of BSA present is calculated to be 16.24 μg in 1 ml solution
Thus, concentration of serum albumin = 16.24 μg/ml
Same method of calculation was applied to tube 12 – 20 included diluted sample in order to calculate mass and concentration of serum albumin in eluent fraction.
Total mass of serum albumin recovered in DEAE column in tube 11 – 20, µg
= 16.24 + 28.43 + 35.53 + 51.27 + 67.01 + 45.18 + 36.04 + 29.95 + 28.93 + 26.40
= 364.98 µg
Percentage recovery of BSA, %
= [ ] × 100%
= x 100%
= 15.84 %
Figure 6: Elution profile of mass of serum albumin against test tube in DEAE column.
ii) CM column
Table 7: mass of BSA in the solution and absorbance in CM column
Figure 7: Standard curve of absorbance, A595 against mass of BSA contained in the solution (µg) in CM column.
Table 8: Mass of serum albumin contained in the solution in µg and the absorbance, A595 at CM column.
Calculation:
Mass of albumin in 1% eluent fraction is calculated using the equation in the standard curve of DEAE column, y = 0.0053x in which y = absorbance and x = albumin mass
By using equation: y = 0.0053x
Mass of serum albumin in eluent fraction in tube 1, µg
0.069 = 0.0053x
x =
= 13.02 µg/0.1ml
When 0.1ml consists of 13.02 µg of serum albumin
1ml consists of = 130.19 µg
Concentration of serum albumin in each eluent fraction in tube 11, g/ 100mL
When the mass of BSA present is calculated to be 130.19 μg in 1ml solution
Thus, concentration is = 130.19 µg/ml
Same method of calculation was applied to tube 1 – 10 and included diluted sample in order to calculate mass and concentration of serum albumin in eluent fraction.
Total mass of serum albumin recovered in CM column in tube 1 – 2, µg
= 130.19 + 145.28 + 226.41 + 271.70 + 292.45 + 264.15 + 256.60 + 305.66 + 271.70 + 283.02
= 2447.16 µg
Percentage recovery of BSA in CM column, %
= [ ] × 100%
= x 100%
= 37.27 %
Figure 8: Elution profile of mass of serum albumin against test tube in CM column.
Discussion:
Part A: SDS-PAGE
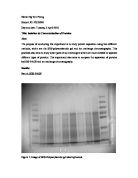
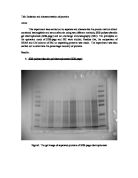
When proteins are to be separated using electrophoresis, sodium dodecyl sulfate polyacrylamide gel electrophoresis (SDS-PAGE) is often chosen. SDS is a strong detergent which can denature proteins, unravelling the tertiary structure of proteins to secondary or primary (Puri, 2006). This is due to the interference to the hydrophobic interactions of proteins which act to stabilize them (Puri, 2006). SDS molecules have negative charges which can mask the proteins intrinsic charges (Puri, 2006). In SDS-PAGE, proteins denatured by SDS require different time. The 5% stacking region in the SDS-PAGE gives proteins time to be completely denatured, ensuring that the samples in all the columns have been denatured and start running in the gel at the same time. From the gel obtained in figure 1, 8 bands were found instead of 9. There is one band missing in the protein ladder, which is the fourth band. One of the possible causes of this result may be due to the gel has been running too long time, causing the fourth ladder band go off into the buffer solution and this could give different measurements within the bands formed (Darling & Brickal, 1994).
From the PAGE image that was obtained in figure 1, it could be seen that all the samples A, B and C have two bands, which are the haemoglobin and bovine serum albumin (BSA). These samples consist of same protein mixtures with different dilution factor which are 1:5, 1:10 and 1:50. Based on figure 1, sample C has the greatest distance migrated followed by sample B and A. This is because sample C has the lowest protein mixture concentration with dilution factor of 50, which means among all three samples with equal volume of sample, sample C has the least amount of protein mixture present in the solution. The lower the amount of sample presents in a well, the lesser the friction the sample will have to overcome in the gel, hence travelling faster to the opposite pole. This is seen as a greater distance travelled.
In the protein mixture, BSA used is only 1% while haemoglobin used is 3%. This indicates that there is more haemoglobin in the protein mixture. Therefore, molecular weight of haemoglobin present is greater than molecular weight of serum albumin present. Theoretically, haemoglobin has a bigger molecular weight which is 64kDa while as for serum albumin, its theoretical molecular weight is 45kDa (Adair et al., 2002). Mobility of proteins is inversely proportional to the logarithm of their molecular weight (Manz, Pamme & Iossifidis, 2004). Hence when the protein mixture comprised of these two protein molecules are separated using SDS-PAGE, greater molecular weight of haemoglobin travels slower than BSA. Hence the upper darker bands in the sample wells represent haemoglobin while the lower lighter band represents BSA. This is similar to that of concentration, the greater the molecular weight value, the slower it takes to move through the gel as it is bigger in size (Boyer 2009; Rehm, 2006; Roe, 2001). As a conclusion from the gel image shown in figure 1, for sample A, B and C, the first band, which is 8.497kDa, 8.135kDa and 7.788kDa respectively, shows the experimental molecular weight of haemoglobin. As for the second band in sample A, B and C are 65.892kDa, 63.083kDa and 60.392kDa respectively which are the experimental molecular weight for serum albumin.
The difference between both the theoretical and experimental values observed, is due to certain factors. For example, the presence of other constituents within the sample may lead to the bands being longer or thicker as the concentration is also affected (Boyer 2009; Rehm, 2006; Roe, 2001). Furthermore, it might also due to the electrophoresis process running too long, some of the later bands could have flow out of the gel, and this too could give different measurements within the bands formed (Darling & Brickal, 1994).
Part B: Ion-Exchange Chromatography
In the ion exchange chromatography part, for each of the column, DEAE is a positively charged exchanger, while CM column is a negatively charged exchanger (Boyer 2009; Rehm, 2006; Roe, 2001). As for the isoelectric point of haemoglobin, it is 6.8, while the isoelectric point of serum albumin is 4.9 (Malainey, 2011). For the DEAE column, the histidine buffer at pH 6 was used, hence, with an isoelectric point of haemoglobin with 6.8, it will not bind to the resin beads as it has a higher value compared to pH 6 which results in a negative charge. Serum albumin with an isoeletric point of 4.9 will be positively charged in the histidine buffer and bind to the negatively charged resin beads (Boyer 2009; Rehm, 2006; Roe, 2001). Hence, when the sample is eluded out of the DEAE column, the first 10 tubes will contain the haemoglobin that does not bind to the resin beads. After that, the addition of KCl will increase the ionic strength of the buffer, resulting in the unbinding of the serum albumin proteins to the resin beads and will be eluded into the next 10 tubes (Boyer 2009; Rehm, 2006; Roe, 2001).
As for the CM column, the resin beads in the CM column is a cation exchanger, hence, with the buffer (MES) at pH 6, haemoglobin which is negatively charged will bind to the resin beads due to its isoelectric point at 6.8, while serum albumin will be positively charged, also due to its isoelectric point where it is at pH 4.9 (Boyer 2009; Rehm, 2006; Roe, 2001), thus it will not bind to the resin beads. Hence, the first ten tubes will contain serum albumin that does not bind with the resin beads, while the last ten tubes will contain the haemoglobin after being unbind from the resin beads with the help of KCl (Boyer 2009; Rehm, 2006; Roe, 2001).
From the elution profile of haemoglobin in DEAE as shown in figure 3, the graph was not a completely bell shape curve as started from tube 5, it has drop rapidly. This may due to the amount of protein eluded too fast at tube 4 which its absorbance, A578 was 0.121 indicated large amount of protein was eluded. As a result, tube 5 has a rapidly drop in amount of protein which can be shown by its absorbance value with 0.055 at 578mm. As compared to the CM column in figure 4, a very obvious bell shape curve was observed. The bell shape curve is due to the amount of proteins being eluded at different concentration and ratios during the process (Boyer 2009; Rehm, 2006; Roe, 2001).
Based on the elution profile of serum albumin in DEAE column, there was a very smooth bell shape curve as shown in figure 6. While in figure 7 which is CM column, it has no obvious bell shape curve as shown. At the first few tubes, the concentration of the protein is low, because protein of smaller size will elude out faster, resulting in a smaller concentration. As the time proceeds, the bigger portion or concentration of proteins will then be eluded out, and this gives rise to the peak formed in the graph (Boyer 2009; Rehm, 2006; Roe, 2001).
Another calculation that was observed was the percentage recovery for both proteins in both columns. The recovery rate for haemoglobin was higher in the DEAE column which is 98.28% as compared to CM column which only recovered 68.48%. In both the analysis, DEAE shows better recovery in haemoglobin. DEAE, the positively charged anion exchanger is highly charged at pH 6 – 8. The buffer used during this practical has a pH of 6. Isoelectric point of haemoglobin is around 6.1. DEAE thus has a very strong attraction towards the negatively charged protein molecules, separating more efficiently and productively. While recovery percentage of serum albumin is higher at CM column which it shows the percentage of 37.27% where it was higher than the DEAE column which only recovered by 15.84%. This indicated that BSA works well in CM column. CM exchanger is negatively charged cation exchanger which attracts cation most efficiently at pH 4.5. Buffer used in CM column is pH 6. Hence, it is less efficient in separating BSA which has an isoelectric point of around 4.7. This shows that the DEAE column is suitable used to separates the haemoglobin while CM column is suitable used to separate serum albumin as the recovery percentage shows the amount or percentage of pure proteins being isolated (Boyer 2009; Rehm, 2006; Roe, 2001).
Of the two methods to separate proteins, IEC would yield a more accurate result as compared to SDS-PAGE. SDS-PAGE only shows bands which, for the determination of types of proteins present, it has to be referred to a protein ladder. Sometimes the bands may not be obvious enough to determine the distance migrated. Hence determination of types of proteins may not be accurate. In IEC, proteins bound to the charged resin beads to different extent according to their polarity. The results then passed to the detector to be analysed, presenting types of proteins present as peaks at particular retention time. Peaks and retention time are different for different proteins. Hence this will produce result which is much more accurate. Besides, proteins sizes may vary greatly. In electrophoresis, pore size is even throughout the gel. Proteins with smaller size may not be well separated in SDS-PAGE, whereas in IEC, proteins will be adsorbed to the resin beads to different extent, according to their polarity. Proteins which are not adsorbed onto the resin beads will be flowed out first then only the bound proteins will be “knocked off” from the resin beads. This enables better separation of proteins.
Conclusion:
In SDS-PAGE, the greater the concentration of sample, the slower the sample will be travelling at. Molecular weight of haemoglobin for 3 dilution factor of 5, 10 and 50 are 8.497kDa, 8.135kDa and 7.788kDa. While molecular weight for BSA in 3 different dilution factor is 65.892kDa, 63.083kDa and 60.392kDa. This indicated that high molecular weight BSA travelled slower than haemoglobin. Haemoglobin which present at 3% travels slower that BSA which present at only 1%. DEAE column is the most suitable method used to measuring haemoglobin as it has a high percentage of recovery which is 98.28% while CM column only 68.48%. However, CM column separates BSA better since it has higher percentage of recovery which is 37.27% while DEAE only 15.84%. IEC separates proteins better than SDS-PAGE does.
References:
Boyer, R. 2009, Biochemistry Laboratory – Modern Theory and Techniques, Pearson Education, Inc, San Francisco, pp. 130 - 138, 184 -186.
Browmik, G & Bose, S 2011, Analyticals techniques in Biotechnology, Tata McGraw Hill, New Dehli, pp. 179.
Darling, D.C & Brickell, P.M 1994, Nucleic Acid Blotting: The Basics, Oxford University Press, New York, pp. 11-14.
Manz. A., Pamme, N., and Iossifidis, D 2004, Bioanalytical Chemistry, Imperial College Press, U. K. p. 64.
Malainey, M.E 2011. Chapter 33. Separation Techniques. In A Consumer’s Guide to
Archaeological Science, pp. 433 – 442.
Puri, D 2006, Textbook of Medical Biochemistry, 2nd edition, Elsevier, New Delhi, pp. 90.
Rehm, H., 2006, Protein Biochemistry And Proteomics, Acedemic Press, London, pp. 5, 109 – 134.
Pre-lab:
1. The isoelectric point of a protein is the pH where the protein has no net charge and the protein will be less soluble because it has few charges to interact with polar water molecules.
2. Pore size of polyacrylamide gel is determined by the concentration of acrylamide. The greater the concentration of acrylamide, the smaller the size of pore. Another factor affecting pore size of PAGE is the cross-linker (Bhowmik & Bose, 2011). When the cross linker is 5%, the pore size would be the smallest. Any changes in the cross linker will lead to an increase in pore size of polyacrylamide gel.
3. Proteins are macromolecules which are relatively large in size. Entire molecule cannot pass through the pore of PAGE. Hence proteins need to be treated with SDS to denature protein, gives rise to the smaller peptide molecules. Besides, SDS has a part which is negatively charged. This part cover any charges on proteins, gives them negative charge of SDS molecules. The greater the charge a protein has, the more SDS molecules need to bind to. Hence amount of SDS bound to protein molecules is proportional to protein size. This makes SDS-PAGE separates proteins on the basis of size.
4. The KCl works as a means to unbind the proteins that is binding to the resin beads. It changes the ratio of the two solvent which also gives rise to a gradient elution. Hence, creating the right flow rate to have an optimal separation while preventing the diffusion of analytes.