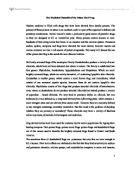
The expected graph dose-response graph that resulted from this is as shown in graph 1.
GRAPH 1: PERCENTAGE CONTRACTION OF PORCINE DETRUSOR MUSCLE IN RESPONSE TO CARBACHOL AND ANTAGONIST COMBINATIONS
From the graph, it is possible to read off values for Rmax and pEC50 with minimal mathematical manipulation for Carbachol alone and Carbachol with the respective antagonist. pEC50 is the negative log of the EC50, which stands for the effective concentration of ligand required to produce a 50% response. The higher the EC50, the lower the pEC50. Rmax is the maximum response obtained by the agonist. It reflects the relative efficacy of the drug.
Using these values, one is able to calculate pKi for the antagonist using Formula 2,3 and 4. These were compared to literature values to define the MAChR in the tissue. pKi is the negative logarithm of Ki, which is the dissociation constant of the antagonist. The higher the Ki, the lower the value of pKi.
CONCENTRATION RATIO= [A2] / [A1]
LOG ( CR -1) = LOG [ANTAGONIST] + LOG Kb
BUT Kb= 1/Ki
USING VALUES FROM THE EXPERIMENT, FOR GROUP E1, CR = 7.9, [ANTAGONIST] = 1X10⁻⁷ M
⇒ LOG (7.9-1) = LOG [1X10⁻⁷] + LOG Kb
0.83885 = -7 + LOG Kb
7.083885 = LOG Kb
0.069X109= Kb
⇒ 0.01449X10-6 = Ki
⇒ pKi =7.84
pKi =7.8 (2s.f)
As shown above, pKi values were calculated for all the replicates of the experiments and for the different antagonists.
Radioligand binding
From the experiment we were able to calculate radioligand affinity, and receptor density (Bmax) from brain and bladder tissue preparations. The pKi values for the antagonists were also calculated and used to define the subtypes present for each tissue.
From data given, regarding [3H]-QNB binding to the particulate preparations, we were able to calculate the mean values for total and non specific binding for each tissue (Formula 5)
– =
The [3H]-QNB specific activity needed to be converted to dpm/femtomole from GBq/mmole. This was done as follows
1GBq=109Bq
1591 GBq/ 1mmole =1591 x109 Bq / 1mmole
1Bq = 60 dpm
1591 x109 Bq /1 mmole = 1591 x109 x 60 / 1 mmole = 9.546x10 13 dpm/ 1 mmole
1 fmole =10-12 mmole
and 1 mmole has 9.546x10 13 dpm
then 1 fmole will have 95.46 dpm
=95.46 dpm/fmole
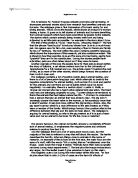
A saturation graph of specific binding (Graph 2) against concentration of radioligand was plotted. This graph enabled us to determine radioligand affinity (Kd) of [3H]-QNB. This is the concentration of radioligand that results in 50% specific binding. This was converted from femtomolar to nanomolar.
GRAPH 2: GRAPH SHOWING SPECIFIC BINDING/dpm VERSUS RADIOLIGAND CONCENTRATION/FEMTOMOLES
For example, Kd in caudate nucleus=0.5X10E6 fmol/L
1 fmole = 10E6 n mole
Kd=0.5 X 10E6 X10E-6=0.5 nm
We were also able to determine Bmax values for the radioligand. This reflects the receptor density in the particulate preparation. Bmax is the maximum specific binding of the radioligand to receptors in the particulate preparation. The values were converted from dpm to fmoles/mg protein.
Considering the Bmax from the graph to be 6842.83 dpm, converting to fmoles
6842.83 / 95.46 = 71.68 fmole present in 0.5mg protein
therefore in 1mg of protein, there are (71.68 x 2) 143.4 fmole/mg.
The estimates of radioligand bound in presence of a range of different concentrations of antagonist were found for each particulate preparation. Six different concentrations of antagonist were used and five tubes containing the same concentration were prepared. Therefore, the mean counts for bound radioligand was calculated for each concentration of antagagonist. The concentrations were multiplied by 10 as a ten-fold dilution was done in the assay. A graph of the amount bound against concentration (Graph 3) was plotted. This was used to find IC50, which is the concentration at which there is 50% inhibition of the specific binding of the radioligand.
GRAPH 3: COMPETITION CURVE OF AMOUNT BOUND/dpm VERSUS Log CONCENTRATION OF ANTAGONIST
The Cheng-Prusoff equation (Formula 6) was used to find Ki.
Ki= IC50 / (1 + [RADIOLIGAND]/Kd )
FOR CAUDATE NUCLEUS, USING METHOCTRAMINE, IC50=3.16 X 10⁻⁷
Ki = 3.16 X 10⁻⁷ / (1+ 0.25/0.5)
= 2.107 X 10⁻⁷ nM
pKi= 6.676
Statistical Analysis
The raw data obtained from the experiment was subject to some statistical analysis, in particular, the standard deviation (SD) and the standard error of the mean (SEM) . The standard deviation is a measure of the variation of the set of data. A difference of one SD about the mean value accounts for 68% of the sample, 95% for a difference of two. SEM is a measure of how well the sample mean represents the population mean. SEM and SD are related by the formula shown below, where N is the number of results from the experimental replications.
AND, SD= ∑(MEAN VALUE - EXPERIMENTAL VALUE )2 . √ ( N-1)
SEM= SD / √N
The larger the sample, the smaller the SEM and thus the better the sample mean represents the population mean.
CHEMICALS
[3H]-QNB (specific activity 1591 GBq/mmole) was obtained from Amersham Pharmacia (Herts, UK), while muscarinic receptor ligands were all obtained from Sigma (Dorset, UK)
RESULTS
REFER TO METHOD FOR THE BASIS OF CLASSIFICATION OF THE RESULTS INTO GROUPS
Contractile response of porcine detrusor muscle tissue.
TABLE 1: COMPARISON OF THE MEAN PEC50 WHEN USING VARIOUS ANTAGONISTS IN THE PRESCENCE OF CARBACHOL AND CARBACHOL ALONE.
When Carbachol, alone is added to the tissue sample to measure contractility, there is generally a higher pEC50 value obtained from such graphs. There is only a 6.3% difference between the highest and the lowest value obtained compared to a 25% difference when the antagonists were added.
The mean pEC50s for the control, using water should have been similar but instead we see a difference of 8% between the values. The highest difference, of 81% between values in a group using the same tissue results from the one which had Atropine as the antagonist. The lowest value of approximately 5% resulted from the group using Pirenzepine. This difference is even lower than that for the control group. The rest of the antagonists did not have a very significant difference between the groups of replicates.
The SEM is similar in both experimental setups and N had an overall decrease for part 1 and 2 of the experiments.
TABLE 2: COMPARISON OF THE MEAN RMAX WHEN USING VARIOUS ANTAGONISTS IN THE PRESCENCE OF CARBACHOL AND CARBACHOL ALONE.
The mean RMAX for the curve depicting Carbachol binding only has a difference of nearly 52% between the highest and lowest value of Pirenzepine and Methoctramine. The graph depicting binding for Carbachol and the antagonist has a difference of 45% between the highest and lowest value of Methoctramine and Atropine.
The control had a difference of 9% between RMAX values before and after adding water. Following the table down the list of antagonists used, the percentage differences between values were 41, 23, 40, 31 and -48% respectively, highlighting the fact that the RMAX goes down in response to adding the antagonist in the case of Methoctramine.
There is a lack of consistency as the N value decreases quite rapidly between part 1 and part 2 of the experiment in some cases. The SEM fluctuates wildly between experiment groups but is generally lower for part 2 except in the case of the control where it increases slightly by 15.
TABLE 3: COMPARISON OF THE CONCENTRATION RATIOS BETWEEN THE VARIOUS ANTAGONISTS AND CARBACHOL.
For the control, the concentration ratio should have been 1. Oxybutynin had the lowest ratio with 4-DAMP overshooting it by 96%. Pirenzepine had a slightly higher ratio but it is much lower than Atropine and Methoctramine which were higher by 92% and 73% respectively.
The SEM once again is fluctuating wildly and not all the experiments yielded usable results.
TABLE 4: COMPARISON OF THE pKi VALUES OF THE VARIOUS ANTAGONISTS
The pKi values show an increase from that of the control, with the highest values being those for Atropine and 4-DAMP. The rank order of values from highest to lowest is similar but not exact as that for Table 3, though 4-DAMP does not record the highest value as in Table 4. The highest and lowest values differ from each other by a range of 24%.
The SEM does not fluctuate as much as in previous tables but is similar in magnitude to the values obtained in Table 1.
TABLE 5: COMPARISON OF THE MEAN pEC50 AND THE RMAX OF CARBACHOL
One can regard the combined results of all the groups for part 1 of the entire experiments as dealt with in this table. For quite a large population size, the SEM for the mean pEC50 values is satisfactorily small but is large for RMAX. Considering the values obtained for the smaller populations (Table 2) the SEM is 94% smaller than the highest value obtained from the group dealing with Pirenzepine.
Radioligand binding of porcine detrusor muscle and caudate nucleus tissue.
TABLE 6: COMPARISON OF THE pKi VALUES BETWEEN TISSUE FROM PORCINE CAUDATE NUCLEUS AND DETRUSOR MUSCLE.
In the case of Carbachol, no useable results were obtained in part 3 of the experiment. Gong down the list of the drugs used (not including Carbachol), the differences between the values obtained for the brain and detrusor tissue are 1%, 10%, 1%, -2%, and -10% respectively, highlighting that 4-DAMP and Methoctramine had higher pKi values when using detrusor muscle tissue.
The range of the values obtained in part 3 has a difference of 18% compared to 32% for part 4. In part 3 the highest value was obtained when using Atropine, in part 4 the highest was with Atropine as well and the lowest with Carbachol. The rank order from highest to lowest for part 3 then part 4 respectively is shown below.
Atropine>4-DAMP>Pirenzepine>Oxybutynin=Methoctramine.
Atropine>4-DAMP> Methoctramine>Pirenzepine>Oxybutynin>Carbachol.
Receptor subtype identification
TABLE 7: REFERENCE PKI VALUES FOR ANTAGONIST USED AT HUMAN CLONED RECEPTORS
From this table we can see that atropine is a non selective antagonist and has highest affinities for all receptor subtypes. Due to this, it will not be considered in the subtype identification. Pirenzepine is most selective for the M1 subtype and Methoctramine can be said to have more affinity for the M2 subtype compared to M3.
TABLE 8: ANTAGONIST pKi VALUES OBTAINED FROM THE RADIOLIGAND BINDING EXPERIMENT
TABLE 9: ANTAGONIST pKi VALUES OBTAINED FROM THE CONTRACTILE RESPONSE EXPERIMENT
From the table above, (table 4, atropine and 4-DAMP have the highest affinities in the bladder detrusor muscle both in humans and in pigs, followed by Methoctramine and Pirenzepine.
The affinities of the various ligands can be ranked as shown above with those with the highest affinities being 1st. From the results, one can compare the pKi values with reference values from human cloned receptors to define the muscarinic subtypes. (Table 7). The rank orders from the results above from the contractile response experiment are inconclusive but it infers that M2 receptors are predominating in the detrusor muscle and the radioligand studies infer that M1 is predominant in the caudate nucleus while M2 subtypes are predominant in the bladder detrusor. The ranges of comparison did not fit in neatly and the best fit was considered while assigning the subtypes to the tissues for each experiment.
DISCUSSION
The aim of this experiment was to identify the muscarinic acetylcholine receptor subtypes present in the pig brain caudate nucleus and detrusor muscle. Generally, the results should be treated with caution as the SEM and N in some cases is variable large and the results are not a good representation of the population mean in some instances. Sometimes the results obtained were illogical and could not be considered or were considered anyway, for example the values for CR for Pirenzepine and water are similar but water should have had a value of 1(Table 3).
The greater the rightward (more positive) shift in the values of EC50, the greater the ability of the antagonist to competitively antagonise the Carbachol ligand on the receptor. From Table 1 it is observed that all the antagonists do work as they all have higher EC50 values compared to the agonist alone. Atropine recorded the highest shift between values and Pirenzepine the lowest; this shift can be related to the potency of the compounds. Increased potency is defined as being more when a smaller concentration of a drug is needed to achieve a similar response at a fixed value.
In the case of the control, a shift in the curve may have been due to desensitization of the tissue and failure of its recovery in the time allocated. This is reflected in the values of pEC50 and the CR from Table 1 and 3. This may affect the reliability of the results as one cannot compare the results with great certainty to the control values.
From studies recorded regarding muscarinic receptors and their subtypes tested with regard to porcine bladder detrusor and caudate nucleus tissue it was found that a small population of M3-muscarinic receptors must mediate direct contractile responses of the pig detrusor muscle to muscarinic receptor stimulation in vitro5 though In urinary bladder, M2 muscarinic receptors predominate.6,
On comparing the results to human cloned receptors it was revealed that that M2 receptors are predominating in the detrusor muscle according to the contractile response studies and that M1 is predominant in the caudate nucleus while M2 subtypes are predominant in the bladder detrusor according to the radioligand studies. Not all pKi vales fit in the reference value ranges as denoted but Table 7. This may be due to experimental errors or that more than one subtype is present in that location or in mediation of a response.
Using results obtained from radioligand binding, in the caudate nucleus the presence of M1 receptors corresponds to the fact that these types of receptors are found in the CNS. The discrepancy arises when the results indicate that M3 subtypes are present as well, which is highly unlikely. The pKi value for 4-DAMP corresponds well with pKi values for M1 M2 and M3. It is unlikely that a M1 receptor is found in bladder as it is found primarily in the CNS. Literature values tell us that the M2:M3 receptor subtype ratio in the bladder is 2:1, corresponding data suggest that the pig bladder possesses a similar muscarinic receptor population to the human bladder and that the M3 receptor subtype mediates contraction of the normal detrusor muscle. However an involvement of M2 receptors in contraction can be observed following pharmacological manipulation of the receptor population such as in disease states.6,10
Limitations of the method could have affected the reliability and accuracy of the results obtained from the experiment. A major limitation is that the experiment was conducted by inexperienced students, it might have been better to have a smaller population of experimenters and a greater number of replicates to minimise inaccuracies or at least to make them consistent so that more of a trend can be seen in the results rather than fluctuations.
Contractile responses
It tries to imitate in-vivo conditions through the use of Krebs ringer solution which was gassed with oxygen. The advantage of this assay is that it gives a quantitative view of the different affinities and related parameters of chemicals on the tissues through the response of the tissue. It can be manipulated to measure relaxation responses. It is quite often used to identify the properties of new drugs in drug discovery processes.
A limitation of this sort of these assays though is that it cannot identify multiple subtypes individually if the affinities of the ligand and receptor are the same. As well, it cannot give an accurate idea of receptor number or changes in numbers because occupancy may not relate to response.
It may be difficult to produce identical replicate results and as well one may get variability as the tissue is viable for a certain amount of time and is slowly dying during the experiment. This limits the amount of compounds one can test and the number of replicates.
The tissue is delicate and needs careful handling and storage. As a result such studies are time consuming and do require a specific knowledge base about the tissue and receptor physiology. Such studies can only be performed on contractile tissues.
There may be some unseen physiochemical effects such as non-specific binding, non maximal responses or endogenous ligand binding. These will affect the accuracy and reliability of the results.
Radioligand binding
Measuring the rate and extent of binding provides information on the number of biding sites and their affinity ad accessibility for various drugs. Thus radioligand binding assays useful in receptor identification and drug discovery.
Radioligand binding assays are a simple but a powerful tool for studying receptors. These assays are used in a variety of disciplines, including pharmacology, physiology, and biochemistry, immunology, and cell biology though primary focus is on assays of membrane-bound receptors.
Few labs are equipped for performing such experiments and handling radioactive substances. The specific activity of the radioligand should be high enough to detect the receptor in the tissue being studied that means a specific radioactivity of at least 30 Ci/mmol.
The radioligand should have a high affinity for the receptor. If the radioligand dissociates rapidly from the receptor, then the radioligand will dissociate from the receptor while removing bound ligand from free ligand. It should have a high degree of selectivity for the receptor being studied so as to avoid non specific binding as much as possible.
The radioligand should not become denatured, be metabolized, or chemically react with other compounds that are in the assay media otherwise the results will not reflect binding of the ligand to the receptor accurately.
It is possible to handle a variety of drugs and process the data quickly leading to faster drug discovery but it does not give an idea about drug efficacy.
During the experiment, the homogenate was viscous and therefore it would have been difficult to know if a representative sample of receptor is used at each time in terms of receptor density.
Further improvements and applications of the study.
It may have been better to use human tissue or diseased tissue in these studies so that we could get a better picture of the actions of the compounds tested and relate them better to therapeutic applications. These views have been discussed by academics and studies have shown that the differences in the reported effects of the spasmolytic agents commonly used for treating overactive bladder suggest that drug action is strongly dependent on the species. Thus, a comparison of drug effects is only feasible in the same animal model and the results cannot easily be transferred to humans. 7,8,11
In terms of physiological differences, other studies on Ca2+ channel properties of pig and human bladder smooth muscle were investigated These results forward the pig as a good model for the human in detrusor Ca2+ channel properties, especially with regard to neural modulation, although voltage-sensitive Ca2+ channels seem to make greater contribution in human bladder physiology8. This may mean that pigs can make suitable substitutes for human studies in contractile response measurements.
On the other hand, porcine and human bladder detrusor were compared in radioligand binding studies using [3H] quinuclidinylbenzilate as the radioligand. We conclude that porcine and human detrusor express muscarinic receptors of the M2 subtype; despite these qualitative similarities the use of the porcine model may be limited by large biological variance with regard to quantitative receptor expression. 11
Yet all these studies utilised healthy tissues, responses from diseased tissues may show different results. It may therefore be better to consider the correlation between human and animal studies in both normal and diseased states before making a conclusion as to the relative suitability of the tissues used and the therapeutic inferences drawn from the results.
Members of the muscarinic acetylcholine receptor family have central roles in the regulation of many fundamental physiologic functions. Identifying the specific subtype(s) that mediate the diverse muscarinic actions of acetylcholine is of considerable therapeutic interest, but has proved difficult primarily because of a lack of subtype-selective ligands.3,12
Overactive bladder (OAB) is a symptom syndrome of urgency with or without urge incontinence. It usually includes frequency and nocturia, which suggest lower-urinary- tract dysfunction. The OAB symptom combination suggests urodynamically demonstrable detrusor (bladder muscle) over activity, but it can be due to other forms of urethrovesical dysfunction. The term OAB generally is used when no infection or other obvious pathology exists. OAB is not urinary incontinence, although many pharmacists believe otherwise.
Many drugs have been tried for OAB. Agents such as atropine had been considered but rejected due to its high incidence of side effects . This is because of its non selective nature. Today, first-line therapy consists of Oxybutynin.
Oxybutynin, used to treat bladder instability for more than 30 years, inhibits acetylcholine’s muscarinic action and exerts a direct antispasmodic effect on smooth muscle, relaxing the bladder’s smooth muscle. Oxybutynin targets the bladder’s M2, and M3 muscarinic receptors as well as M1 receptors in the CNS, which may account for its antimuscarinic side effects that are undesirable especially in the elderly (dry mouth, constipation, impaired cognitive function, restlessness, electrocardiograph changes, and postural hypotension). Its higher affinity for muscarinic receptors in the parotid gland than in the bladder produces a dry mouth. 10. The results from the experiment (table 6 and 4) seem to indicate that Oxybutynin has a low affinity to the receptors compared to the other antagonists though it had higher affinity in the caudate nucleus compared to the bladder.
Tolterodine, a muscarinic receptor antagonist released in 1998, inhibits detrusor muscle contraction without muscarinic- receptor-subtype specificity. Tolterodine targets bladder muscarinic receptors, with less binding affinity to parotid gland receptors. It reduces incontinence and micturition frequency, and it increases the urine volume voided per micturition 7,10.
Current drugs to treat OAB are nonselective. Two investigational agents currently in clinical trials, darifenacin and solifenacin, which specifically antagonize the M3 receptor and may be bladder-selective.10 Such agents will revolutionize treatment by grossly reducing side effects because of their higher efficacy and affinity for receptors localised in the bladder only. This will have a knock-on effect on other areas in healthcare, such as reducing unnecessary time and financial strains on the healthcare system.
CONCLUSION
The objectives of the experiments to identify receptors in the tissues were met. M1 receptors are found in the caudate nucleus. M2 and M3 receptors are found in the bladder detrusor muscle.
Reliability and variability of the results was discussed and sources of errors pinpointed. The advantages and disadvantages of the two assay methods were also compared and contrasted. This was linked to their usefulness in the process of novel drug discovery and the study of current drugs.
This study can be adapted to study binding patterns in diseased state tissues or human tissues and the correlation analysed. A greater number of replicates may be useful in establishing the accuracy of the results.
Novel and related compounds involving enhanced selectivity still need to be developed and emphasis is placed on reducing side effects which seems to plague the current population of patients.
(Word Count 3978)
REFERENCES
1.ALEXANDER, S.P.H., CURTIS, A.R., HILL, S.J., & KENDALL, D.A. (1994). A1 ADENOSINE RECEPTOR INHIBITION OF CYCLIC AMP FORMATION AND RADIOLIGAND BINDING IN THE GUINEA-PIG CEREBRAL CORTEX. BR. J. PHARMACOL., 113, 1501 - 1507.
2. LOT, T.Y. & WILSON, V.G. (1994). OVERNIGHT STORAGE OF THE PORCINE ISOLATED SPLENIC ARTERY ENHANCES ENDOTHELIUM-DEPENDENT CONTRACTIONS TO NG-NITRO-L-ARGININE METHYL ESTER WITHOUT IMPAIRING ENDOTHELIUM-DEPENDENT DILATOR FUNCTION. NAUNYN-SCHMIEDEBERGS ARCH. PHARMACOL., 349, 95 - 100.
3. H.P RANG,M.M DALE,J.M RITTER PHARMACOLOGY FOURTH EDITION PGS 118-112. CHURCHILL LIVINGSTONE
4. JOHN LOGAN BLACK, III ,CASSANDRA L. KNIFFIN ,ALAN F. SCOTT , CHOLINERGIC RECEPTOR, MUSCARINIC, 1; CHRM1, LAST EDITED 2/27/2004. ONLINE MENDELIAN INHERITANCE IN MAN, JOHN HOPKINS UNIVERSITYLAST ACCESED 2004-11-19 .23:03
5. D. J. SELLERS, T. YAMANISHI, C. R. CHAPPLE, C. COULDWELL, K. YASUDA & R. CHESS-WILLIAMS M3 MUSCARINIC RECEPTORS BUT NOT M2 MEDIATE CONTRACTION OF THE PORCINE DETRUSOR MUSCLE IN VITRO JOURNAL OF AUTONOMIC PHARMACOLOGY JUNE 2000 VOLUME 20 ISSUE 3 PAGE 171.
6 YAMANISHI T, CHAPPLE CR, YASUDA K, CHESS-WILLIAMS R.
THE ROLE OF M(2)-MUSCARINIC RECEPTORS IN MEDIATING CONTRACTION OF THE PIG URINARY BLADDER IN VITRO.
BR J PHARMACOL. 2000 DEC;131(7):1482-8
7 . OVERACTIVE BLADDER–MORE THAN A NUISANCE CAPT JEANNETTE Y. WICK, RPH, MBA, AND GUIDO R. ZANNI, PHD LAST ACCESED 2004-11-19 .23:03
8 . KAJIOKA S, NAKAYAMA S, MCMURRAY G, ABE K, BRADING AF.
CA(2+) CHANNEL PROPERTIES IN SMOOTH MUSCLE CELLS OF THE URINARY BLADDER FROM PIG AND HUMAN.
EUR J PHARMACOL. 2002 MAY 17;443(1-3):19-29.
9 . YAMANISHI T, CHAPPLE CR, YASUDA K, CHESS-WILLIAMS R. THE ROLE OF M2 MUSCARINIC RECEPTOR SUBTYPES IN MEDIATING CONTRACTION OF THE PIG BLADDER BASE AFTER CYCLIC ADENOSINE MONOPHOSPHATE ELEVATION AND/OR SELECTIVE M3 INACTIVATION. J UROL. 2002 JAN;167(1):397-401.
10. SELLERS DJ, YAMANISHI T, CHAPPLE CR, COULDWELL C, YASUDA K, CHESS-WILLIAMS R. M3 MUSCARINIC RECEPTORS BUT NOT M2 MEDIATE CONTRACTION OF THE PORCINE DETRUSOR MUSCLE IN VITRO. J AUTON PHARMACOL. 2000 JUN;20(3):171-6.
11.. GOEPEL M, GRONEWALD A, KREGE S, MICHEL MC. MUSCARINIC RECEPTOR SUBTYPES IN PORCINE DETRUSOR: COMPARISON WITH HUMANS AND REGULATION BY BLADDER AUGMENTATION. : UROL RES. 1998;26(2):149-54
12 . WALDECK K, LARSSON B, SANDBERG B, ANDERSSON KE. ACTIONS OF THE NEW ANTIMUSCARINIC COMPOUND LU 25-109 ON ISOLATED HUMAN AND PIG DETRUSOR. NEUROUROL URODYN. 2002;21(1):92-8.