0.5 % starch buffered to pH 6.7
1% NaCl solution
Fearons reagent
20% NaOH solution
pH 6.7 buffer
Amylase solution
Distilled water
Tongs
Boiling tubes
Boiling tube rack
100 cm3 measuring cylinder
1, 5 and 10 cm3 pipettes and safety pumps
Gloves
Goggles
Cuvettes
Stop clock
Colorimeter
Ice Bath (0 oC),
Water baths
Bunsen burner
Tripod
Gauze
Heatproof Mat
Safety
- Lab coat (protect clothes)
- Safety goggles (protective eye care)
- Rubber gloves (protect hands. 20% NaOH is a corrosive irritant)
Method
- Firstly put all safety equipment on (lab coat, safety glasses and gloves)
- Prepare 7 test tubes, label them s1 to s7.
-
Place 5cm3 of buffered starch, 2cm3 of pH 6.7 buffer, 1cm3 of 1% NaCl in each of them.
-
Using a pipette place 5cm3 of the amylase solution into 7 separate tubes (labelled E1 to E7).
- Tubes S1 and E1 in to the ice bath
- Tubes S2 and E2 in to the room temperature water bath
-
Tubes S3 and E3 in to a water bath at 30oc.
-
Tubes S4 and E4 in to a water bath at 40oc.
-
Tubes S5 and E5 in to a water bath at 50oc.
-
Tubes S6 and E6 in to a water bath at 60oc.
-
Tubes S7 and E7 in to a water bath at 70oc.
- Tubes were left for 5 minutes in order to allow them to equilibrate.
- At 0 time on the stop clock, the contents of E1 to tube S1 were mixed
- The tube containing the mixture was placed back into the ice bath
- After 30 seconds, the same was repeated with tubes e2 and s2.
- The process was repeated for all the tubes at 30 second intervals.
-
At 5 minutes on the stop clock 1cm3 of the 20 % NaOH was added to the first tube in the ice bath and the contents were mixed thoroughly. This terminated any further reaction, and the test tube was then removed from the ice bath.
- At exactly 30-second intervals the above step was repeated for each tube.
-
Exactly 0.5 cm3 of Fearons reagent was added to each tube.
- The tubes were then mixed thoroughly and heat in boiling water for 2 minutes, at which point the tubes developed a red colour.
- The tubes were then removed and allowed to cool to room temperature.
- Using distilled water as a reference and a 430 filter the colorimeter was used to make a quantitative colour comparison of each tube
Results
Discussion
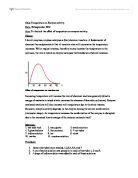
From the graph, a gradual increase in enzyme activity is shown up to around 40oC. After this there is a slight fall from 40 to 50oC. From 50oC onwards, there is a sharp drop. The peak on the best fit line shows the temperature where the enzyme was at its highest activity. This is around 40oC.
Conclusion
The results do satisfy the aim, as it is shown from them that enzyme activity is actually affected by the temperature.
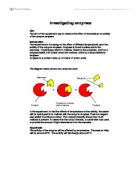
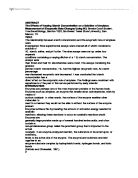
The hypothesis was also found to be correct, as the temperature does actually rise up to 40oC, but it does not fall sharply beyond 40oC, it actually drops gradually to 50oC, but then it does fall sharply thereafter. The peak activity temperature was around 40oC. This is because enzymes are actually quite sensitive to temperature. Enzymes are natural substances, when temperature increases, their shape changes. This means that substrates cannot actually fit into the active site on the enzyme, hence no reaction. At above 40oC, the temperature is high enough to disfigure the enzyme enough so that the reaction does not occur. This only affects some of the enzyme at around 50oC, but above this, a very large amount of the enzyme is affected hence dropping the activity.
Limitations
From the graph and best fit line, the plot for testube s6 (60oC),appears to be anomalous. A reason for this may be that the measurement from the colorimeter may have been read incorrectly. This was due to the meter on the colorimeter was analogue, making it harder to read.
An improvement for this would be to use a digital meter as this would be easier to read.
Another reason for this anomaly could have been timing. If the test tubes were not mixed at the right time, or things weren’t added at the right intervals, this could mean that some tubes may have had more time to react than others, producing more maltose.
Reference:
http://www.celltech.com/resources/vt/images/lockkey.gif