Protein Purification. Purification is done after the proteins and some other components like lipid material, polysaccharides, salt, and water in a concentrated solution are extracted from the source, in this experiment, green papaya. In this experiment, ion-exchange chromatography would be employed with the use of the AKTA Prime System 2.0, a fast protein liquid chromatography system. Fast protein liquid chromatography is used to separate and purify proteins from complex mixtures with a liquid mobile phase and a solid or liquid stationary phase. In fast protein liquid chromatography, the solvent velocity is controlled by pumps to control the constant flow rate of solvents. The solvents are accessed via tubing from an outside reservoir. Moreover, ion-exchange chromatography isolates substances based on the resin used and the degree of their ionic charge. The column to be utilized is chosen based on its type and the degree of their ionic charges so Amersham Hi-Trap Sephadex Desalting Column would be used. To retain and separate negatively-charged proteins, positively-charged anion exchange resins are used while negatively-charged cation exchange resins are used for separating positively-charged proteins. Deionized water and Tris-HCl buffer are separately pumped through the column to equilibrate the opposing charged ions. As the salted extract was injected to the system, the protein molecules and other compounds present in the sample exchanged with the buffer ions because they compete for the binding sites on the resin. The strength of the protein’s charge determines the length of retention. The first that would elute are the weakly-charged proteins and followed by those with successively stronger charges.
SDS-PAGE. Gel Preparation. Usually, the gels used are composed of acrylamide, Tris, SDS, APS and TEMED. To prevent air bubbles during polymerization, the solutions should be degassed. However, degassing wasn’t done in the resolving gel solution so the preparation of the gel was done with utmost care to prevent trapping air bubbles. Ammonium persulfate (APS) and N,N,N',N'-tetramethylethylenediamine (TEMED) were also utilized to initiate the gel formation of polyacrylamide. The lowest catalytic concentrations of APS and TEMED should be used because increasing their amounts can cause an increase in gel turbidity and a decrease in the average polymer chain length and gel elasticity. Acrylamide molecules are joined together by head on tail manner in a slow but spontaneous process. When polyacrylamide, which is a polymer of acrylamide monomers, is formed, it turns into a gel. A polyacrylamide gel is made up of a labyrinth of tunnels through a meshwork of fibers. Gels are polymerized in a gel caster. The resolving gel is poured to allow it to polymerize. After adding the isobutanol, the loading gel is poured and a comb is placed to create the wells where the samples and the standard would be injected for the electrophoresis. The stacking gel’s relatively lower %T, which determines the movement of the protein, makes protein separation impossible. Resolution then happens as the proteins move to the resolving gel as it has a relatively higher %T causing proteins to have a similar starting position at the resolving gel.
Addition of Gel Loading Buffer-Dithiothreitol Mixture to the Sample. Before running the samples into the setup, GLB-DTT mixture was added to the sample. The gel loading buffer is made up of Tris-HCl, SDS, bromophenol blue and glycerol. To resolve protein mixtures and isolate and separate the proteins effectively, they were denatured with the SDS in GLB so that the proteins wouldn’t have any secondary, tertiary or quaternary structure. SDS makes the multimeric proteins to dissociate into their subunits, and all polypeptide chains are forced into extended conformations with similar charge:mass ratios. SDS treatment obliterates the effects of the disparities in shape so that chain length, which reflects mass, is the sole determinant of the migration rate of proteins in SDS-PAGE. Since each protein has an isoelectric point and molecular weight specific to its primary structure, different proteins with the same molecular weights would migrate differently if SDS wasn’t added due to the differences in mass:charge ratios. The protein mixture was also heated in a water bath at 100oC. Boiling the protein mixture in the presence of SDS enables it to wrap around the polypeptide backbone. SDS binds to proteins in a constant weight ratio of 1.4 g SDS per 1.0 g protein providing a uniform mass:charge ratio for most proteins. Consequently, the distance of protein’s path through the gel can be assumed to be directly related to only its size.
Moreover, Tris-HCl was used because it is an innocuous substance to most proteins and it mimics the condition in the cell as it has a pKa of 8.3 making it an effective buffer in the pH range of 7-9. Bromophenol blue, on the other hand, was used as a tracking and marker dye since proteins are mostly colorless. It is necessary to trace their paths during electrophoresis for the experimenters to stop the run before they run off the gel. It gives the samples a blue color as it binds with the proteins weakly. Glycerol was also used as a weighing agent as it weighs down the samples into the wells so that it wouldn’t spread as it is being loaded. It also helps in the storage of proteins because it maintains the protein mixture at low temperatures without freezing it. Another component of the mixture is DTT, a reducing agent, which guarantees the complete denaturation of the protein as it disrupts the protein’s disulfide bonds. This helps in ensuring that the proteins run uniformly through the gel during electrophoresis.
Electrophoresis. The running buffer that was used contained Tris, SDS, and glycine. SDS and Tris serve similar functions as mentioned earlier while glycine is the source of trailing slow ion. Glycine’s pKa of 9.69 makes it possible for its effective mobility to be set at a value less than that of the slowest negatively-charged proteins within the pH range. The BIO-RAD Mini Protean 3 System was then set with the gel and the running buffer for the electrophoresis of the samples. Since the samples were already denatured and negatively charged, application of electric field will result to the migration of the proteins towards the positive electrode. As discussed earlier, polyacrylamide gel was used to put the proteins into an environment that will allow varyingly-sized proteins to move at different rates. Because of the pores of the gel, smaller proteins would travel longer through the gel as compared to larger ones since the smaller proteins would fit through the pores more easily than the larger ones would.
Silver Staining. To detect proteins after electrophoretic separation on polyacrylamide gel, silver staining would be employed. Silver staining is generally made up of six basic steps. First, fixation with the use of methanol and acetic acid would be done to get rid of interfering compounds. Washing with methanol and sensitizing with sodium thiosulfate would then be done to increase the contrast and sensitivity of the staining. After that, there would be a silver impregnation with silver nitrate solution. Developing with formalin and sodium carbonate would then be done to build up the silver metal image. Lastly, acetic would be used to stop and rinse to end development prior to to excessive background formation and to remove excess silver ion and other chemicals prior to further processing. Basically, the binding of proteins to silver ions is the principle behind silver staining. Silver ions, which are linked to proteins, can be reduced to metallic silver subsequently forming the image.
IV. Results and Analysis:
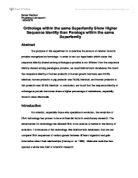
Fig. 2. Chromatogram of the ion-exchange chromatography of one of the 4 runs
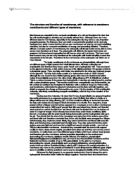
Fig. 3. SDS-PAGE Gel of the samples.
As shown in Fig. 2, the chromatogram of one of the four runs illustrates a blue and red curve signifying the UV absorbance and conductance of the sample. It can be seen that fraction 4 has a relatively high UV absorbance which is probably caused by the colored compounds in the sample mixture. As the UV absorbance decreases, the conductance started to increase signifying an increase in ion concentration or the elution of the salt. However, the UV absorbance started to increase again as the conductance started to decrease. This second rise might signify the presence of the proteins although the peak was relatively low indicating that the concentration of the protein is stumpy. The fractions that were collected contained the maximum protein concentration and minimum salt concentration.
On the other hand, figure 3 shows the SDS-PAGE gel used in the experiment. The first and third well from the right contained the crude extract and the standard respectively while the remaining wells contained the purified samples. The standard used was Promega Broad Range Protein Marker with protein samples of molecular weights 10, 15, 25, 35, 50, 75, 100 since the gel utilized is 12%T. As shown in Figure 3, the standard has 7 bands while the crude extract has 4. However, the remaining samples didn’t have any band. So only the crude extract can be compared to the standard for the weights of the proteins present.In theory it is possible to quantitatively determine the actual molecular weight of the proteins in kDa. This can be done by plotting the distance travelled of the band from the well against the molecular weights of specific bands specified by the company. Since the crude extract has 4 bands from the lowermost part of the gel, it can be concluded that the extract has proteins weighing 10, 15, 25, and 35 kDa. This further proves that one of the proteins isolated from green papaya is papain which weighs 38.9 kDa. Since the purified samples didn’t show any clear band, it can be assumed that the ion-exchange chromatography wasn’t accurately and precisely done.
V. Conclusion:
Based on the diagrams of the chromatogram and the SDS-PAGE gel used, it can be concluded that proteins were successfully isolated and extracted from green papaya. The SDS-PAGE gel shows that the crude extract contains proteins that weigh 10, 15, 25, and 35 kDa as compared to the standard. This proves that papain, which is predominant in green papaya, was successfully extracted as it weighs 38.9 kDa based on literature values. However, the other samples didn’t show any clear band signifying that the ion-exchange chromatography wasn’t employed accurately and precisely.
VI. References:
Boyer, R. (2006) Concepts in Biochemistry. New York: John Wiley and Sons. 3rd ed.
Harris, E. L. V. Protein Purification Applications. England: Information Press Ltd. 1995.
Fleischer, S., J.O. McIntyre and J.C. Vital. 1979. Meth. Enzymol. 55: 32-39. Large Scale Preparation of Rat Liver Mitochondria in High Yield.
Lu, A.Y.H., and W. Levin. 1978. Meth. Enzymol. 52: 193-200. Purification and Assay of Liver Microsomal Epoxide Hydrase.
Scope, R. K. 1982. Protein Purification. Principles and Practice. Springer-Verlag, New York.