Although many aspects of human eating behaviour may have helped humans to survive in a natural environment, these same aspects of human eating behaviour are frequently maladaptive in our current environment. People easily learn to prefer high-calorie, sweet, and salty foods and therefore we are more likely to gain than lose weight. We also tend to choose food available relatively soon and inexpensively over other, more nutritious alternatives not available until later. Evolutionary theory can help us to see how humans may have evolved to exhibit these behaviours, and how all of these behaviours appear to be ones that would have helped humans to survive in nature. It helps us to see the general, and more specific, functions of these behaviours, and allows us to make predictions with regard to the eating behaviour of humans in new situations (Rozin, 1996; Siegal, 1995; Winn, 1995).
In our current environment, these behaviours contribute significantly to our population being overweight and suffering from various health problems associated with overeating. In the natural environments of most species, digestible calories are not freely available and frequently are not available in sufficient amounts. In such environments, animals that can learn quickly which foods contain significant amounts of calories would be more likely to survive than other animals that have not learned this. As omnivores have such a wide variety of food sources it would be impossible for them to be born with the knowledge of which foods have the highest calorie content. Instead, it would be most adaptive for animals to have the ability to learn to prefer, after brief exposure to them, foods that contain substantial amounts of calories. Booth (1982) has been able to show that adult humans can learn to eat smaller meals when those meals contain a disguised high-calorie starch load associated with a distinctive taste. Further, if the subjects consume these meals when food deprived, preference for this kind of meal increases as the subjects gain experience with it. However, if the subjects consume these meals when satiated, the opposite occurs; the subjects' preference for these meals decreases as the subjects gain experience with them (Booth, 1982; Booth, Mather, & Fuller, 1982). Birch and Deysher have extended these findings to preschool children (Birch & Deysher, 1985). These researchers have demonstrated that preschool subjects learn to eat smaller meals following a taste that has been previously associated with a high-calorie snack, and larger meals following a taste that has been previously associated with a low-calorie snack. There are more practical implications that can be derived from this research. If maladaptive eating habits are identified, they can be treated by employing methods such as those used by Booth, in order to combat their present cognitions. We can also use various self-control techniques such as precommitment to ensure that we engage in behaviours that are of long-term great value, instead of engaging in behaviours that bring us only some immediate satisfaction.
The present study had three main aims: to identify a correlation between depression and negative eating attitude and determine the difference in this correlation between overweight and normal weight participants. The second aim is to establish whether memory bias exists for food and mood/body image words compared to neutral words in overweight people, and whether there is a difference in normal weight participants. The third aim is to a establish a positive correlation between negative eating attitude and the number of food words recalled and a correlation between depression and the amount of mood and body image words recalled. If participant’s weight has also affected their mood, then they may have a tendency to remember words associated with the way they are feeling and body image words they associate with themselves. They may also be more likely to remember words that they are striving to become such as ‘thin’ and ‘pretty’.
To achieve the first aim of the study, the differences between overweight participants and normal weight participants were identified using the different measures.
1) Depression was assessed with the Beck Depression Inventory (BDI) questionnaire (Beck Ward, C. H., Mendelson, Mock, & Erbaugh, 1961) the scores for each participant were calculated for later correlational analysis to the second questionnaire.
2) Negative eating attitude was assessed using the Eating Attitude Test (EAT-26), (Garner, Olmstead, Bohr, & Garfinkel, 1982) and the participants scores were calculated so they could be correlated with their BDI scores. The first hypothesis is that overweight participants will show a positive correlation between BDI scores and EAT-26 scores and normal weight participants will have a lower correlation between the two.
The second aim was achieved by assessing which types of words participants recalled, and whether more food and mood/body image words were recalled compared to the neutral words. The list had 64 items, containing neutral words, food words and mood/body image words. The second hypothesis is that the overweight participants will recall a higher percentage of food, body image and mood words compared to percentage of neutral words and the normal weight participants will have an equal proportion of words, showing no memory bias. The words on the list that are not neutral are split equally into positive and negative versions of that word type. The third hypothesis is that negative word types are more likely to be recalled than positive words types for the food and mood/body image words and this will be seen to a lesser extent in normal weight participants compared to overweight participants. This is because negative food words (foods that are bad for you) are more likely to be recalled by dieters and negative mood words are more likely to be recalled by people with higher levels of depression.
The third aim entailed comparing the questionnaire scores for each participant to the types of words they recalled.
1) BDI scores were correlated with mood and body image words for overweight and normal weight participants.
2) EAT-26 scores were correlated with food words for overweight and normal weight participants.
The fourth hypothesis is that overweight participants BDI scores will positively correlate with the total number of mood and body image words recalled and that their EAT-26 scores will positively correlate with the total number of mood words recalled. Normal weight participants should show no, or low correlation between EAT-26 and food items recalled however the correlation between BDI and mood and body image words recalled by normal weight participants will depend on the individual’s BDI score. If the score is low then the correlation should also be low.
Method
Design
A cross-sectional survey design is employed for the correlational research section of this study. The first variable of the design was weight. The Body Mass Index for every keep fit participant (52 in total) was calculated from their weight and height. Those who did not have a BMI which put them in the overweight category were excluded from the study (2 participants were in the normal weight range); the rest became the experimental group. The same was done with the students, however this time their BMI had to put them in the normal weight category. All 50 participants had a normal weight categorisation, so no further data collection was needed; these 50 participants became the control group. The second variable of the design was depression score, which was taken from both the experimental group (overweight) and the control group (normal weight). The third variable was negative eating attitude score, which again was taken from both groups of participants and correlated with their depression score. The strengths of these correlations were then compared for each group.
Table 1: Table of corresponding categories for BMI scores.
An experimental independent measures design was used for the memory bias section of the research.
The fourth variable was the number of the different word types recalled by both groups of participants. These different word types were compared between and within groups to determine any significant differences. Correlations were then carried out between both designs to see if depression and negative eating attitude scores predicted memory bias for certain word types. The strengths of these correlations were also compared for each group. The effects of distraction from other participants were controlled by spacing out the participants as much as possible within the rooms and asking the participants to complete their tasks in silence.
Participants
This study used 100 participants. The experimental group included 50 female members of a keep fit class ranging from the age of 34 - 63; the mean age was 45 years and 6 months with a standard deviation of 3.86. The keep fit class were chosen by non-probability, purposive sampling as the characteristics this study was seeking to identify and correlate could be more heavily associated with a group of overweight people (seeking to lose weight/improve their personal image). The control group included 50 female students, from Royal Holloway University. Their ages ranged from 19-25 with a mean age of 22 years and 5 ½ months, and a standard deviation of 1.95. Both the experimental and control group contained mainly Caucasian participants with only two Asian participants in the experimental group and four Asian participants in the control group. The students were chosen using accidental sampling as they were mainly serving as a control group to identify the difference, if any, between the two groups of individuals. They were selected based on the judgement that they did not appear to be either overweight or underweight. This method of sampling does not have the best reliability or generalisability, but time constraints were an issue when selecting participants. It is also not ideal to use a control group with such an age difference, however it would have proven difficult to produce a further group of women in their 40’s or 50’s to use in the study, so for ease and again because of time constraints a group of students were chosen. Using two different sample types may have had an effect on the results; possible consequences of this will be looked at further in the discussion.
Materials
Two inventories were administered and scored for this study assessing participant’s depression and eating attitude. A list of 64 words was also administered containing 32 neutral words, 8 positive food words (foods which are good for you) and 8 negative food words (foods which are seen as bad for you). The list also contains 8 positive and 8 negative mood and body image words. The words were randomised and spaced out to prevent order effects. The words were selected from the various studies mentioned that assessed memory bias in participants with eating disorders, depression or in those who are dieting. Positive food words included items such as “apples” and “carrots” while negative food words had items such as “chocolate” and doughnut”. Examples of positive mood/body image words include “pretty” and “comfortable” and negative mood/body image words include “obese” and “unhappy”. Neutral words were unrelated to any of these categories and included words such as “tin” and “shoe” (the full list of these words can be found in appendix I). The list was then scored to test for memory bias in relation to the proportion of food, mood and body image words recalled, compared to the number of neutral words recalled. A pair of scales and a measuring tape was also needed to weigh participants and measure their height.
Depression
The Beck Depression Inventory (BDI), (Beck, Ward, Mendelson, Mock, & Erbaugh, 1961) was used as a measure of participant’s depression. The test has 21 items, where participants are asked to select a response from a list of 4 options, each with a score ranging from 0 – 3; a maximum score of 63 was therefore possible which would represent extremely high levels of depression.
Table: Interpreting the Beck Depression Inventory
Total Score Levels of Depression
1-10 These ups and downs are considered normal.
11-16 Mild mood disturbance.
17-20 Borderline clinical depression.
21-30 Moderate depression.
31-40 Severe depression.
over 40 Extreme depression.
A persistent score of 17 or above indicates a
possible need for professional treatment.
The questionnaire was not altered as the wording was easy to understand and it would be unnecessary to alter a tool which has proven to be both a reliable and valid measure of depression. Internal consistency for the BDI ranges from .73 to .92 with a mean of .86, (Beck, Steer, & Garbin, 1988). The BDI demonstrates high internal consistency, with alpha coefficients of .86 and .81 for psychiatric and non-psychiatric populations, respectively (Beck et al., 1988). The BDI also has a split-half reliability co-efficient of .93. Beck et al., (1961) however, did not recommend conventional test-retest reliability for his original measures for the BDI (1961). Alternate test-retest reliability methods by Beck et al., (1961) found that regardless of whether the 2 tests were reissued at 2 or 6 weeks intervals the scores on the inventory tended to reflect only the changes in the clinical depth of depression. The content of the BDI was obtained by consensus from clinicians regarding symptoms of depressed patients (Beck et al., 1961), so there will be good content validity relating to depression.
Eating Attitude
The Eating Attitude Test (EAT) - 26, (Garner, Olmstead, Bohr, & Garfinkel, 1982) was used to assess eating attitude. The test has a section at the top which also records participant’s weight, height and age so their BMI could be calculated. Participants BMI was calculated by dividing their weight by their squared height (BMI = kg/m2).
The EAT-26 assesses a broad range of symptoms and provides a total score for disturbed eating attitudes and behaviour. A score of more than 20 on the EAT-26 indicates excessive concerns that may indicate the presence of an eating disorder. Total scores on the EAT-26 are derived as a sum of the composite items, ranging from 0 to 78. Scores that are greater than or equal to 20 on the EAT-26 are frequently associated with abnormal eating attitudes and behaviour and may identify those with an eating disorder (Garner, Olmsted, Bohr, Garfinkel, 1982). The EAT-26 consists of 26 forced-choice, 6-point items forming 3 subscales, Dieting, Bulimia, Food Preoccupation, and Oral Control. These items are assigned to the three subscales as follows: Dieting scale items: 1, 6, 7, 10, 11, 12, 14, 16, 17, 22, 23, 24, 25; Bulimia & Food Preoccupation scale items: 3, 4, 9,18, 21, 26; Oral Control subscale items: 2, 5, 8, 13, 15, 19, 20. Respondents must rate whether each item applies "always," "usually," "often," "sometimes," "rarely," or "never." Responses for each item are weighted from 0 to 3, with a score of 3 assigned to the responses furthest in the "symptomatic" direction (item 25 is the only negatively keyed item on the EAT-26), a score of 2 for the immediately adjacent response, a score of 1 for the next adjacent response, and a score of 0 assigned to the three responses furthest in the "asymptomatic" direction. The EAT-26 has acceptable criterion- related validity; the reliability (internal consistency) of the EAT-26 is also high ( = 0.90) (Garner, Olmsted, Bohr, Garfinkel, 1982). (Copies of both inventories can be found in appendix I)
Procedure
The experimental group was tested together at the beginning of the keep fit class. The rest of the participants were chosen using oaccedental sampling on the University campus and were tested in a quiet room in groups of five. Each participant needed to read and sign a consent form to participate, so they were aware of what the study was about and what was expected from them before they took part. The participants were guaranteed anonymity and were known only by number so they felt more comfortable about disclosing any information. Each participant was measured and weighed at this point as the EAT-26 questionnaire would require them to insert these details so their BMI could be calculated. They were weighed and measured in privacy, so no one had access to another participant’s information. They were then given the list of words for two minutes in which time they were asked to commit as many as they could to memory. After two minutes the list was taken away and the participants were asked to write down as many of the words as they could remember. They were given a further three minutes to do this and then asked to stop writing. The participants were then given the two inventories, which they were asked to complete carefully and in silence. The inventories and word list had simple standardised instructions, informing participants how they should be completed. When they had completed all the tasks they were thanked for their help and then debriefed. The participants were then asked if they had had any difficulties completing the tasks and any questions they had were answered.
Once the data was collected, appropriate measures were taken to eliminate any participants from the study who do not fit the criteria outlined for either the experimental group or the control group. The EAT-26 has a preliminary question asking the participants whether they think they are overweight themselves. As mentioned, control participants had to be in the normal weight category but they also had to answer ‘no’ to this question. This is because those who are not medically overweight, and think that they are may show certain cognitive patterns similar to those who are actually overweight, for example, excessive dieting behaviour. For similar reasons if any of the control participants had a BMI putting them in the underweight category they would have been excluded from the sample as research has shown that cognitive bias for food words exists in both overweight and underweight people. The control group had to contain people who had no obvious or immediate weight problems in order for a comparison with the experimental group to be made. The data was then ready for statistical analysis.
Results
Correlating BDI scores and EAT-26 scores
The raw data from the study were collected and the questionnaires were scored for each participant. The data was analysed using a Pearson correlational test. The correlations were compared for each group of participants.
Table 3: The mean scores for BDI and EAT-26 for students and keep fit class and the standard deviations.
Hypothesis 1: Overweight participants will show a positive correlation between BDI scores and EAT-26 scores and normal weight participants will have a lower correlation between the two.
The means in table 3, show higher scores for the keep fit participants for both questionnaires, however the students score much lower than the keep fit class for the EAT-26 but the difference between means for the BDI is much less. The standard deviations for BDI scores were similar for both groups however for EAT-26 scores the students have a lower standard deviation indicating that there was less deviation from the mean and the students did not score as high on the EAT-26 as the keep fit class.
A Pearson correlation was conducted on the scores of the two questionnaires for each set of participants. There was a significant positive correlation between BDI and EAT-26 scores for the keep fit class (r = 0.727, n = 50, p < 0.05). There was also a significant positive correlation between BDI and EAT-26 for students (r = 0.558, n = 50, p< 0.05). To measure the amount of variability in one variable that can be explained by the other, R² was used. BDI score accounts for 50.8% of the variability in EAT-26 scores for the keep fit class and only 31.1% of the variability in students. There are therefore factors other than depression that account for negative eating attitude and other factors other than eating attitude that account for depression. However more variability is accounted for between BDI scores and EAT-26 scores for the keep fit participants compared to the students as the hypothesis predicts.
Comparing percentages of word types recalled
The raw data was collected and the number of words participants recalled was calculated. From this, the numbers of neutral, food and mood/body image words were calculated. These figures were then transformed into percentages to firstly, work out whether the total percentages of food and mood words recalled were higher than the percentages of neutral words recalled, and secondly to see which specific word types were recalled compared to the neutral word types.
Table 4: Mean percentage of neutral words recalled compared to the total percentage of the other word types recalled for both groups.
Hypothesis 2: Overweight participants will recall a higher percentage of food, body image and mood words compared to the percentage of neutral words, and the normal weight participants will have an equal proportion of words, showing no memory bias.
The means in table 4 reveal a much higher percentage of recall for food and mood words compared to neutral words. Both groups however have similar means for both the percentage of neutral words recalled and the total percentage of food and mood words recalled, which is contrary to prediction.
A two way ANOVA was conducted to test for a difference between neutral word type and total food and mood/body image word type between groups. A significant effect of word type was found (F (1,196) = 35.699, p < 0.05). This indicates that participants did show memory bias for food and mood words compared to neutral words. A non-significant effect of group was found, (F (1,196) = 0.309, p = 0.579) and a non significant interaction between word type and group was found, (F (1,196) = 0.054, p = 0.817). This means there was no significant difference between groups in the proportion of neutral words recalled compared to food and mood/body image words.
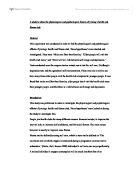
Figure 1: Graph showing mean percentage of word types recalled
Hypothesis 3: Negative word types are more likely to be recalled than positive word types for food and mood/body image words and this will be seen to a lesser extent in normal weight participants compared to overweight participants.
Figure 1 shows that both groups of participants recalled a lower percentage of neutral words compared to the other word types. Both groups also showed higher recall for negative food and negative mood/body image word types, compared to the positive words and neutral words.
A two way ANOVA was conducted to test for an interaction between word type and percentage of word type recalled by groups. There was a significant effect of word type (F (4, 490) = 7.183, p < 0.05), meaning that there was a significant difference between the types of words recalled for both groups. A two way ANOVA also revealed a non-significant effect of group, (F (1,490) = 0.152, p = 0.697), and a non-significant interaction between group and word type (F (4,490) = 0.344, p = 0.848). Therefore there was no significant difference between groups for the types of word they recalled. According to the hypothesis, the students should have shown no significant differential memory for word types.
Employing the Games Howell post hoc test, significant differences were found between neutral words and negative food words recalled by keep fit participants and students, (p < 0.01) and between neutral words and negative mood words (p < 0.01). However analyses revealed no significant differences were found between the neutral and positive food word types, and between the neutral and positive mood word types, (p > 0.01 for all). There was also no significant difference between positive mood and negative mood or positive food and negative food, or between positive mood and positive food or negative mood and negative food (p > 0.01 for all).
Therefore both students and keep fit participants recalled more negative words compared to neutral words and positive words, and this is seen to a similar extent in students, as the hypothesis predicts. In fact, the means for both negative word types recalled were higher for students compared to the keep fit class.
Correlating BDI and EAT-26 scores with food and mood/body image words
Hypothesis 4: Overweight participants BDI scores will positively correlate with the total number of mood and body image words recalled and that their EAT-26 scores will positively correlate with the total number of mood words recalled. Normal weight participants should show no, or low correlation between EAT-26 and food words recalled and between BDI and mood and body image words recalled.
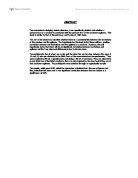
Figure 4: Table showing the strength of correlations between BDI and EAT-26 and the different word types.
The data was analysed using Pearson correlational tests. There was a significant positive correlation between BDI scores and the amount of mood/body image words recalled by the keep fit class (r = 0.588, n = 50, p < 0.05, one tailed). Students however had no significant correlation between BDI and mood words recalled (r = 0.229, n = 50, p = 0.054, one tailed). The amount of variability in one variable that can be explained by the other was measured using R². BDI score accounts for 34.5% of the variability in mood/body image words for the keep fit class and only 5.2% of the variability in students. There are therefore variables other than BDI score which are responsible for the amount of mood words recalled and factors other than the amount of mood words that are responsible for BDI score. However more variability is accounted for between BDI scores and mood words for the keep fit participants compared to the students.
There was also a significant positive correlation between keep fit participants EAT-26 scores and the total number of food words recalled, (r= 0.579, n =50, p < 0.05, one tailed). Students again had no significant correlation between EAT-26 and food words recalled (r = 0.172, n =50, p = 0.116, one tailed). EAT-26 score accounts for 33.52% of the variability in food words recalled for the keep fit class and only 2.9% of the variability in students. There are therefore variables other than EAT-26 score which are responsible for the amount of food words recalled and factors other than the amount of food words recalled that are responsible for the EAT-26 score. However more variability is accounted for between EAT-26 scores and food words for the keep fit participants compared to the students
As mentioned no significant correlations were found between EAT-26 scores and mood words for keep fit participants or between BDI and food words for both students and keep fit participants, however a significant positive correlation was found between students EAT-26 scores and mood words recalled ( r = 0.304, n = 50, p = 0.16, one tailed). R² reveals that EAT-26 score can explain 9.2% of the variability in mood words recalled.
Figure 4 shows that the strengths of the correlations between BDI and mood words, and EAT-26 and food words. Keep fit participants and students BDI score was not a good predictor of the number of food words recalled, and the EAT-26 was not a good predictor of the number of mood words recalled by participants. However in the case of the students, their EAT-26 scores show a positive correlation with mood words.
This analysis indicates that overweight participants EAT-26 score accounts for more variability in the amount of food words recalled and their BDI score accounts for more of the variability in the amount of mood/body image words recalled compared to the normal weight participants. These facts support the hypothesis.
Discussion
The results obtained when investigating the first hypothesis demonstrate that overweight and normal weight participants have produced a significant correlation between depression and negative eating attitude, however overweight participant’s results accounted for a higher percentage of the variability between the two inventories. This means more variables (other than depression and eating attitude) were responsible for the variance in normal weight participant’s results, as almost 70% of the variability was unaccounted for. Therefore it is likely that although normal weight participants are showing similar levels of depression to overweight participants, their depression is related to a greater extent, to factors other than their eating attitude. However, almost 50% of the variability was still unaccounted for in overweight participants, which still means that eating attitude is not the only factor related to depression in overweight participants. Thus, in this case the hypothesis was accepted as BDI and EAT-26 score did correlate with one another and the overweight participants scores were related to each other by a higher percentage than the normal weight participant’s scores. This supports the research already outlined that shows a link between depression and eating attitude and in this case between depression and being overweight.
The reasons why the students may have high scores for depression may be because of exam stress and essay deadlines, which they must adhere to. They may therefore be under more pressure, in that respect, than the keep fit class and this may account for one of the other factors relating to their depression. Female adolescents are also more preoccupied with physique and appearance than are those in other age groups (Bruch, 1981). As research has shown, there is a relationship between physical appearance and self esteem, and a relationship between self esteem and depression; it could therefore also be that these students have higher expectations of themselves to look good and if they don’t, this could contribute towards their depression. Physical appearance is therefore another factor which could affect student’s depression.
Overweight participants also have other factors contributing towards their depression and towards their eating attitude. There is experimental evidence suggesting that overweight women who endorse in the values of hard work, self-discipline and personal responsibility are more anxious and depressed than overweight women who don't (Quinn and Crocker, 1999). They also tend to have lower self-esteem which may explain why some women did not score highly on the BDI and others did. Those who care little about being overweight may therefore become less depressed than those who do care, and this may be an explanation for some of the variance between overweight participants. It was felt at the time that because the participants took part in a keep fit class, this would be an adequate reason for the assumption that they did care about their weight; more precautions should have been taken to ensure that this was the case. Extra questions relating to body satisfaction could have provided the solution to this problem. More significant results may have been found if, when selecting the participants this was taken into consideration. For example, those in the control group who showed body dissatisfaction could have been excluded from the sample, so more reliable measures could have been taken.
As mentioned, due to time constraints the samples chosen were of very different ages and therefore much more reliable results could have been obtained by comparing overweight and normal weight participants of the same age groups. There are variables which can cause depression in overweight participants and there are variables which can cause depression in people who are not overweight; in the same way middle age women and students can have very different reasons for the causes of their depression. Middle-aged women and students could also have different reasons for their negative eating attitudes; for example younger females are under grater pressure to be slim than middle aged women, however middle-aged women may be putting huge pressure on themselves to stay looking young and slim.
The design of the experiment itself may have affected the results. For example the BDI could have been measuring the participants current mood and not reflect their depression state overall. The EAT-26 could have also not picked up on some of the factors which assess negative eating attitudes. It would therefore be wise, if the experiment was repeated to use either a variety of inventories to assess these particular factors or simply more up to date inventories which assess any newly theorised symptoms of depression and negative eating attitude.
When investigating the second hypothesis, there was a significant difference found between the proportions of neutral words recalled compared to the total of the other word types recalled. Both groups of participants recalled significantly less neutral words compared to the other word types, therefore both showing memory bias for the word recall task. There was also no significant difference between groups which means normal weight and overweight participants showed similar memory bias. This contradicts the hypothesis, as it was expected that no significant difference would be found between the types of words recalled by the normal weight participants. This could be explained by the fact that the student’s depression scores could reflect a coinciding memory bias for mood words in the same way that keep fit participants memory was biased. If the study were to be conducted again then the control group would contain only those without a weight problem, eating disorder and they would have to show no signs of body dissatisfaction or depression. Similarly, overweight participants would have to show body dissatisfaction to make the results reliable and valid. A preliminary investigation would need to be conducted before the actual study, to establish whether the participants have the characteristics that they need in order to be compared with the other group. Another problem may have been with the word list itself. There may have been words which were more emotionally arousing for some participants and therefore were more likely to be remembered despite the category in which they appeared. Further preliminary studies may have revealed if any problems existed with the word list. Those words that tended to be remembered more than others despite the participant type could have been excluded. In this case the word “chocolate” was recalled by the majority of people as this is a food item which is highly desirable and which most people like and therefore may stand out more from the other words, even if that person has no problem with their eating attitude.
The results of the third hypothesis revealed that negative word types were recalled significantly more than positive and neutral word types for both groups of participants. Students in this case had higher means for both negative mood and negative food words recalled. This again conflicts with the hypothesis as it was expected that the keep fit group would recall more negative words which were associated with their particular cognitive problems. However there was a non-significant interaction between word type and group, therefore the difference between the amounts of negative words recalled was not significant between the two groups.
The students may have recalled more negative mood words because they were depressed and as mentioned there is more pressure on younger women to be beautiful and thin so this could explain why negative body image words were recalled at a higher proportion to neutral words. Negative foods such as “pizza” are also more heavily associated with younger people, as young people may have not yet had to face the consequences of over eating and therefore tend to eat junk food until these consequences start appearing, such as becoming fat. As evolutionary theory states, we prefer salty, sweet or fattening foods because there was a time when our survival was dependent on obtaining enough food to sustain us and put us one step above the others. Therefore a preference for foods with high calorie content evolved because less quantity of these food types were needed compared to foods that contained less calories and fat. This may be an explanation not only for why people become fat, but for why the participants in this study recalled more negative food words than positive food words.
It may also have been that although the students may not have been obsessed with food in the way that the dieters may have been, memory bias may still have been shown for the types of foods they enjoy. This is further support for using two groups of participants with similar ages so differences such as these can be avoided. As mentioned by eliminating participants in the control group who show signs of depression certain biases could have been avoided in the memory task. The results support the findings that normal dieters show attentional bias to shape and food stimuli, however this means that research on memory bias in patients with eating disorders may be less significant than was first thought (Mogg et al. 1998). Also, hungry people in general can show attentional bias which may help to further explain why the normal weight participants may have remembered more food words compared to neutral words. The explanation for memory bias in overweight participants who are dieting could be explained by the evidence in humans that increasing deprivation level decreases self-control for food (Forzano & Logue, 1992; Kirk & Logue, 1997). Therefore if food and body image are always on a person’s mind because of dieting, they will be more likely to show memory bias for stimuli related to these things; this supports the work of Pratt (1999), who found similar results when testing groups of participants.
When investigating the fourth hypothesis, significant correlations were found between BDI and mood words recalled and EAT-26 and food words recalled for the overweight group but not for the normal weight group. This supports the hypothesis and other research that depression is likely to predict a bias for mood words and that a negative eating attitude is likely to predict a bias for food words; however only 34% of the variability in mood words was accounted for by BDI score and only 33.5% of the variability in food words was accounted for by EAT-26 score. This means there are other variables responsible for overweight participants word recall than their score on the inventories. As mentioned this could have something to do with methodological issues such as the construction of the word list or the difference in age between the two participant types. As mentioned the students showed no correlation between the inventories and word types recalled. This supports the hypothesis that their depression did not affect the mood words they recalled and their negative eating attitude did not affect the food words they recalled. This may be because the word list contained mood words which were related more towards the feelings one would have if they were depressed because they were overweight. If words such as “stress”, or “pressured” had been used then there may have been a correlation between BDI score and mood words recalled by students. As the EAT-26 mean score for students was lower than for the keep fit participants, and measures were taken to ensure only normal weight participants belonged to the control group, it was less likely that there would be a correlation between the two as most of the students showed no serious eating attitude problem. However the students did have a significant positive correlation between the amount of mood words recalled and their EAT-26 scores. The reasons for this are unclear as there are no logical explanations for why this should have happened other than that those few participants who did score highly on EAT-26 did tend to remember more mood words. This reflects the effect a negative eating attitude can have on a person’s state of mind, which in turn can be reflected in their memory bias. Methodological problems already outlined may explain why this same positive correlation was not seen in the overweight participants as well.
Apart from improving the methodology of this study it may be interesting to conduct further studies which examine race and gender differences as this study used mainly white, females. This was done because eating disorders, which include anorexia and bulimia, appear to afflict Caucasians more frequently than African Americans or Asians. It was therefore felt that more significant results would be produced from this sample; however race comparisons would be interesting to establish whether the link between depression and body image dissatisfaction is in turn linked to race. Research on gender differences have shown that women are more likely to identify themselves as overweight than are males (Kann, Kinchen, & Williams, 1998). This was therefore a reason for the selection of female participants, however in order to gain a full view of the effect depression has on eating attitude and memory bias, both genders need to be investigated. However, Lane (2003) found no difference between men and women athletes who took mood and eating attitude tests. This may be because athletes do not have the same mental structures about food that other people do and as both female and male athletes have to follow similar strict diets and exercise routines this may reflect the similarity in their correlations between the two variables.
Exercise could also be investigated to determine whether the amount of exercise a participant does effects their depression or eating attitude. It has already been shown that dieting can affect memory bias; however the effect it can have on the correlation between depression and negative eating attitude should be addressed. Weight could also be correlated with depression and eating attitude to see if participants actual BMI effects their levels of depression.
Overall it can be concluded that the overweight participants did show a correlation between depression and eating attitude. The nature of this relationship definitely requires further investigation as the effects can be worrying if taken to the extremes and can result in eating disorders. If this predicament is detected early enough then something can be done to prevent the problems from increasing, such as cognitive-behavioral therapy. The cognitive biases associated with depression and negative eating attitudes can also be challenged in therapy to hopefully encourage people not to be so obsessed with food or their body image. As the population levels of obesity are rising something obviously needs to be done to combat the effect of the ever increasing access to foods which are high in fat, salt or sugar. As the food we are eating is changing, the education about that food needs to change in order to provide us with more information about the foods which are good for us and the foods which are bad for us.
References
Bandura, A. (1977). Social Learning Theory. Englewood Cliffs, NJ: Prentice-Hall.
Beck, A.T., Ward, C. H., Mendelson, M., Mock, J., & Erbaugh, J. (1961). An inventory for measuring depression. Archives of General Psychiatry 4, 561-571.
Beck, A.T., Steer, R. A., Garbin, M. G., (1988) Psychometric properties of the Beck Depression Inventory: Twenty-five years of evaluation. Clinical Psychology Review 8 (1)
Beck, A.T., Rial, W. Y., Rickets, K. (1974). Short form of Depression Inventory: Cross-validation. Psychological-Reports 34 (3), 1184-1186.
Benedikt R, Wertheim E.H, Love A., (1998) . Journal of Youth and Adolescence 27 (1): 43-57
Birch, L.L, Deysher, M (1986) . Appetite 7 (4): 323-331.
Booth, D. A. (1982). How nutritional effects of foods can influence people's dietary choices. In L. M. Barker (Ed.), The psychobiology of human food selection (pp. 67-84). Westport, CT.
Booth, D.A, Mather P, Fuller, J (1982). . Appetite 3 (2): 163-184.
Bruch, H. (1973). Eating disorders: Obesity, anorexia nervosa and the person within. New York: Basic Books.
Bruch, H. (1981). .
Canadian Journal of Psychiatry - Revue Canadienne de Psychiatrie 26 (4): 212-217.
Coopersmith, S. (1981). Self-esteem inventories. Palo Alto, CA: Consulting Psychologist Press. 94, 102-105.
Forzano L, B, Logue, A, W, (1992). . Appetite 19 (1): 33-47.
Frederick, C., & Grow, V. (1996). A Mediational Model of Autonomy, Self- Esteem, and Eating Disordered Attitudes and Behaviours. Psychology of Women Quarterly, 20, 217-228.
Gardner R.M, Friedman B.N, Jackson N.A, (1999) . Psychological Record 49 (4): 555-563.
Gardner R.M, Friedman B.N, Jackson N.A (1999). . Journal of Youth and Adolescence 28 (5): 603-618
Garner, D. M., Olmsted, M. P., and Bohr, Y. & Garfinkel, P. E. (1982). The Eating Attitudes Test: psychometric features and clinical correlates, Psychological Medicine, 12, 871-878.
Garner, D., Olmsted, M., & Polivy, J. (1983). Development and Validation of Multidimensional Eating disorder inventory.
Green, M, Corr, P, De Silva L, (1999) Cognitive Theory Research 23 (4): 413-422.
Grubb, H.J., Sellers, M., & Waligroski, K. (1993). Factors Related to Depression and Eating Disorders: Self-esteem, Body Image and Attractiveness. Psychological Reports, 72, 10003-1010.
Guinn B, Semper T, Jorgensen L, et al. (1997). . Journal of School Health 67 (3): 112-115.
Harrison, K. & Cantor J. (1994). The Relationship Between Media Consumption and Eating Disorders, Journal of Communication, 47, 40-67.
Harter, S. (1982). The perceived competence scale for children. Child Development, 53, 87-97.
Hermans, D, Pieters, G, & Eelen, P, (1998). Implicit and explicit memory for shape, body weight, and food-related words in patients with anorexia nervosa and non-dieting controls. Journal of Abnormal Psychology, 107 (2): 193-202.
Kann L, Kinchen SA, Williams BI, et al. (1998).. Journal of School Health 68 (9): 355-369 NOV 1998
Kaye, K.J, (1995). . Faseb Journal 9 (14): 1500-1501.
Kirk JM, Logue AW, (1997). . Appetite 28 (3): 215-226.
Laessle R. G, Schweiger U, Pirke K. M. (1998) . Biological Psychiatry 23 (7): 719-725
Lane, A. (2003) Relationships between attitudes towards eating disorders and mood. Journal of Science and Medicine in Sport 6 (2): 144-154.
Mintz, L. B. (1988). Body image, self-esteem and depression proneness: Closing the gender gap. Journal of Sex Roles, Psychological Reports, 72, 1003-1010.
Mintz, L. B. & Betz, N. E. (1988). Prevalence and correlates of eating disordered behaviours among undergraduate women. Journal of Counselling Psychology, 35, 463-471
Mogg K, Bradley BP, Hyare H, (1998) Behavioural Research Theory 36 (2): 227-237.
Polivy J, Herman C, P, Heatherton T, F, (1993) . Journal of Personality 61 (1): 49-61.
Quinn D, M, Crocker J., (1999). . Journal of Personality and Social Psychology 77 (2): 402-414.
Rieger E, Schotte DE, Touyz SW, (1998) . International Journal of Eating Disorders 23 (2): 199-205
Ross, C, E (1994) . Journal of Health and Social Behaviour, 35 (1): 63-79.
Rozin, P (1996) . Current Directions in Psychological Science,5 (1): 18-24.
Sands, R, Tricker, J., Sherman, C., Armantas, C., & Maschette, W. (1997) Disordered Eating Patterns, Body Image, Self-esteem and Physical Activity in Preadolescent School Children. International Journal of Eating Disorders, 21, 159-166.
Sebastian, S.B, Williamson, D.A & Blouin, DC. (1996). Memory bias for fatness stimuli in the eating disorders. Cognitive Therapy and Research, 20 (3): 275-286.
Striegel-Moore R, H, Silberstein L, R, Rodin, J, (1986). . American Psychologist 41 (3): 246-263.
Williamson D,F, Serdula M,K, & Anda, R, F, (1992). American Journal of Public Health 82 (9): 1251-1257.
Wurtman, J.J, (1993) . Affect Disorders, 29 (2-3): 183-192.