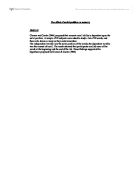
A few years later, the Board of Education installed noise absorbing material in the ceilings of the classrooms that faced the tracks. The Transit Authority also installed resilient-rubber pads on the tracks, significantly lowering the noise levels in the classroom, the students reading scored in both classrooms were examined again and it was found that they were both on the same level.
The aim of the experiment was to find out if the level of noise in an environment can affect learning and the storing of memory, not just reading ability. It has been said that high levels of noise can reduce a persons potential for learning anything new because it interferes with speech understanding. I wanted to test this theory in my own study.
There are 3 processes involved in storing memory:
- Encoding – The event itself taking place then the process of storing the information into our memory.
- Storage – Keeping the information fro later use and how it is linked to other similar facts and events already stored.
- Retrieval – How memories get retrieved from storage for retelling when required.
Hypothesis:
Experimental Hypothesis:
Participants will recall a greater number of words in a quite environment compared to the number of words recalled in a loud environment.
It is predicted that there will be a relationship between the number of words remembered and the level of noise in the environment. This experiment is a one-tailed hypothesis as it predicts and outcome in a particular direction.
Null Hypothesis:
There will be no significant difference in the number of words recalled from the person in either the quite environment or the loud environment.
Directional Hypothesis:
This study is a 1-tailed hypothesis as it predicts the direction in which the results are expected to occur. i.e. A noisy environment will impair a person’s ability to remember words and concentrate.
Independent Variable:
The volume of each environment. (Noise/Environment).
Dependent Variable:
The number of words remembered and
Methodology:
Design:
A laboratory experiment was used with an independent design measures. In this experiment the Independent Variable was the level of noise in the environment and the Dependent Variable was the number of words recalled in each of the conditions.
Materials:
Sheets with the words on that were handed out to participants. (See Appendix)
Sample:
My chosen sample was an opportunity sample that was both male and female (9 males and 11 females) between the ages of 16 and 47. My sample was from London and Manchester and all were able to read and write with English as a first language. I collected the sample through volunteers of friends and family.
Procedure:
- Decided what my study was going to be.
- Selected the sample.
- Decided how to present the information to participants (Written Format).
- Prepared materials (Different environments, word list and stop watch).
- Decided the length of time participants should be given to recall the list of words (1 minute and 30 seconds).
- Decided the volume of noisy environment.
- Prepared data recording sheet.
- Gathered the participants into 2 groups of 10 people.
- Provided participants with verbal instructions.
- Split the sample participants into two different rooms – one room quiet and the other with music playing at volume 40 (The highest level possible).
- Handed out materials – Word sheet, 1 sheet of paper and a pencil.
- Timed participants as they carried out the study for 1 minute and 30 seconds.
- Obtained research data (Number of words recalled in each of the environments).
- Summarised data by using data summary sheet.
Data:
I have presented my data in a data summary sheet and a data analysis table where I worked out the measures of central tendency (Mean, Median and Mode).
I have also presented the final scores in a chart showing the mean, median and mode.
I used to Mann Whitney U test to find out the level of significance for my study (See Appendix).
Results:
Calculations for the Value of U:
100 + 55 – 55 = 100
The value of U at <0.05 level of significance = 27
Therefore the results are not significant.
As the calculated value of U is higher than the critical value, the hypothesis can be rejected and the null hypothesis has to be accepted.
Charts of Measure of Central Tendency:
Condition 1 = Quiet Environment
Condition 2 = Loud Environment
Discussion:
Quantitative Data:
This study looks at only the numbers of data gathered; I never got any explanations as to if any other factors contributed towards memory recall on the day of experiment. Only looking at number data could have affected the results because nothing in the data gathered tells you if people were taking it seriously or just not concentrating properly. An improvement for this experiment would be to gather qualitative data to explain why people recalled the number of words that they did so you would know if your results were accurate. Two measures in this study would be better than one.
Usefulness:
This study can be used to help towards improving learning and revision techniques as it shows that more words can be recalled in a quiet environment and I think not everyone realises this. This study can then be applied to learning and can help when revising things other than words too. To make this study further useful I could’ve used more in depth information (Like a paragraph of information) and asked participants to recall the important facts out of the paragraph in each condition. Improving the study this way would mean I could give an accurate account if learning/revising in a quiet environment does help memory and concentration.
Sample:
My chosen sample is representative of the general public – mixed sex, ages, location etc. I tried to choose the largest sample possible so my research wasn’t limited and was as valid as possible to the UK. An improvement so that my study could be applied 100% to real life would be to have a wider race of people and even a random selection of participants from different countries. This would mean that my research could be applied to everyone.
Strengths and weaknesses of this design outline:
The advantage of using different participants in each condition is that there will be no problems caused by “order effects” or boredom in doing the same thing again.
The disadvantages are that difference in the performance between the two groups may be caused by individual differences e.g. Lack of interest, rather than the manipulation of the variables. This design also means that twice as many participants need to be found.
A matched pairs design could stop individual differences from affecting my results.
References:
Mann-Whitney U test protocol cited in:
Introducing Research and Data in Psychology; Ann Searle
Bronzaft and McCarthy study cited in:
Webpage;
Appendices;
Contents:
Page 11: List of words
Page 12: Data Summary Sheet
Page 13: Data Analysis Sheet
Food:
Apple
Bread
Peppers
Cake
Lentils
Chocolate
Shoes:
Trainers
Sandals
Boots
Flip-Flops
Slippers
Stilettos
LIST OF WORDS:
Countries:
Austria
Spain
France
Turkey
Greece
Cyprus
Days of the Week:
Sunday
Monday
Wednesday
Friday
Star Signs:
Capricorn
Taurus
Virgo
Aquarius
Pisces
Leo
Girls Names:
Sarah
Emma
Britney
Jessica
Gwen
Angelina
= 34 Words
Data Summary Sheet:
Data Analysis Sheet: