Concentration of haemoglobin in 1/10 dilution sample = 917.14 µg/ml
Concentration of haemoglobin in 0.1ml undiluted sample = 917.14x10
= 9171.4µg/ml
Mass of haemoglobin in 0.1ml undiluted sample = 9171.4 µg
Since 0.2ml of original sample was added to the column, mass of haemoglobin in undiluted sample = = 18342.8µg
Mass of haemoglobin in undiluted protein mixture for CM column
Concentration of haemoglobin in 1/10 dilution sample = 382.86 µg/ml
Concentration of haemoglobin in 0.3ml undiluted sample = 382.86x10
= 3828.6µg/ml
Mass of haemoglobin in 0.3ml undiluted sample = 3828.6 µg
Since 0.2ml of original sample was added to the column, massof haemoglobin in undiluted sample = = 2552.4µg
Percentage recovery of haemoglobin
Percentage recovery of haemoglobin = x100%
= 18.79%
*This calculation was repeated for both DEAE and CM column. The results were tabulated in table 5.
- Determination of serum albumin
Table6. The absorbance of different mass of proteins in standard BSA and original sample at 595nm in determination of serum albumin using DEAE column
Figure4. The graph of absorbance of protein at 595nm against the mass of protein in standard BSA solution, µg in determination of serum albumin using DEAE column
Table7. The absorbance of different mass serum albumin in each eluent fraction of DEAE column
Table8. The absorbance of different mass of proteins in standard BSA and original sample at 595nm in determination of serum albumin using CM column
Figure5. The graph of absorbance of protein at 595nm against the mass of protein in standard BSA solution, µg in determination of serum albumin using CM column
Table9. The absorbance of serum albumin each eluent fraction of CM column
Figure6. The elution profile of serum albumin from DEAE column and CM columns with mass of serum albumin against the test tube number.
Table10. Percentage recovery of serum albumin from protein mixture in DEAE and CM column
Calculations:
Mass of serum albumin
From figure 4, it was shown that the relationship between the absorbance and the mass of protein in standard BSA can be illustrated using the formula, y = 0.002x.
Absorbance = 0.025
0.025 = 0.002x
Mass of serum albumin in 0.1ml of sample = 12.5µg
Since 1ml of sample was collected from the column, the mass of serum albumin in 1ml of sample = =125 µg
*This calculation was repeated for all the eluent fractions of DEAE and CM column. The results were tabulated in table 7 and 9.
Total mass of serum albumin recovered
= 125+155+175+200+290+470+556+210+260+165
= 2815 µg
*This calculation was repeated for both DEAE and CM column. The results were tabulated in table 10.
Mass of serum albumin in undiluted protein mixture
Mass of serum albumin in 0.002ml protein sample = 33.50µg
Since 0.2ml of original sample was added to the column, mass of serum albumin in undiluted protein sample = = 3350 µg
*This calculation was repeated for both samples of DEAE and CM column. The results were tabulated in table 10.
Percentage recovery of serum albumin
Percentage recovery of serum albumin = x100%
= 84.03%
*This calculation was repeated for both DEAE and CM column. The results were tabulated in table 10.
Discussion:
For the separation of protein mixture using ion exchange chromatography, it can be seen that both the elution profiles obtained in determination of haemoglobin and serum albumin, peaks are observed for both DEAE and CM column. The peaks for determination of haemoglobin using DEAE and serum albumin using DEAE and CM appeared to be in the middle of the test tubes which are among test tubes 5 and 6. This is because at the beginning of the experiment, the protein mixture was just added into the column. The time taken for the protein mixture to sip inside the column is shorter which resulted in some of the proteins were still above the column and not fully sip in the column. When the chromatography started, the first few test tubes contained only low amount of protein separated as only little amount of protein sip into the column. After a short period of time, more protein will be separate by the column as the pressure caused the protein mixture to flow down. It can be observed that for the last few test tubes, the amount of protein being collected was lower due to the reason that most of the proteins were separated by the column and fewer amounts of proteins were left. However, for the determination of haemoglobin using CM column, the peak of the elution profile was slightly skewed to the left which indicated that more separated protein was collected in test tubes 2 and 3. This may due to the reason that more haemoglobin have arrived at the bottom of the column by the time the haemoglobin was collected as the protein mixture was left too long to be sip into the column.
It can be seen that in determination of serum albumin using CM column, negative absorbance of serum albumin was obtained for test tube 10. According to Skoog et al. (2007), absorbance is directly proportional to the concentration of the solution. This indicated that there was no serum albumin in the solution. The negative value may due to the reason that the blank solution used to blank the spectrophotometer was contaminated with other substances. Before the absorbance of serum albumin was taken, the spectrophotometer was blank with a blank solution which contained every substance similar to the sample solution except for the particles needed to be determined. If a negative value was obtained, it showed that the absorbance of the blank is higher than the absorbance of the sample.
In this experiment, it was shown that the first 10 test tubes of protein samples collected using DEAE column were used in determination of haemoglobin and the next 10 test tubes of protein samples were used in determination of serum albumin. Haemoglobin carries positive net charge and serum albumin carries negative net charge. DEAE is an anion excharger which carries positively charged ion-exchange resin. This caused the negatively charged serum albumin to bind to the resin of the column but not the positively charged haemoglobin. As a result, the unbound haemoglobin will be eluted first form the DEAE column with the serum albumin remained attached to the resin. The serum albumin will only be eluted out using KCl. Serum albumin was found to have negative net charge at pH6 due to deprotonation. This indicated that the isoelectric point of serum albumin is lower than pH6. Hua et al. (2008) claimed that the isoelectric point of serum albumin is 4.8. This showed that the result obtained in this experiment was consistent with the theoretical result.
Likewise, the first 10 test tubes of protein samples collected using CM column were used in determination of serum albumin and the next 10 test tubes were used for determination of haemoglobin. This is because CM is a cation exchanger which has negatively charged resin. The positive net charged species will bind to the resin and the negative net charged species will be eluted out first. Since haemoglobin positively charged and serum albumin is negatively charged, the haemoglobin will bind to the resin and the serum albumin will be eluted out first. Hence the first 10 test tubes contained serum albumin instead of haemoglobin. After the addition of KCl, the haemoglobin will be released from the resin and will be collected in test tubes 11 to 20. Since haemoglobin carries positive net charge at pH6 due to protonation, the isoelectric point of the haemoglobin will be higher than pH6 which was consistent with the theoretical result, pH6.8- 7 (Hua et al., 2008).
In this experiment, KCl was used to elude the species bound to the resin. Changing pH value which affect the charge or increasing the ionic strength of the resin will release the species from the resin. KCl has a higher ionic strength than the MES od histidine buffer. As a result, KCl will bind to the resin easier and elute the bound haemoglobin or serum albumin. Also, coomassie blue reagent was used as a dyeing agent in determination of serum albumin. This is because serum albumin is colourless and absorbance cannot be measured. The coomassie blue reagent will form blue protein-dye complex by interacting with the amino group of serum albumin. This made the serum albumin can be detected by spectrophotometer as the complex have high extinction coefficient.
It can be seen that for both the standard curves plotted for determination of serum albumin using DEAE and CM column are different as in the concentration of each standard was different even though they were prepared in similar ways. The protein samples prepared in 1/10 and 1/50 dilutions also have different absorbance. This may due to the parallax errors when measuring the concentration and the volume of standard BSA or distilled water needed. Also, it may due to the contamination of the solutions, causing the absorbance of same concentration solutions to vary. The protein samples were diluted because concentrated protein samples may have a very high absorbance value being measured as absorbance is directly proportional to concentration. This may cause the absorbance of undiluted protein sample to be out of range of the standard curve prepared in determining the mass of serum albumin present. As a result, inaccurate results will be obtained.
In this experiment, it was found that the percentage of recovery of haemoglobin using DEAE and CM column was 18.79% and 73.54% respectively. This showed that CM column is more efficient in separate haemoglobin. On the other hand, the recovery percentage of serum albumin using DEAE and CM column was 84.03% and 106.43% respectively. Similarly, CM is more efficient in separate serum albumin. However, the recovery percentage of serum albumin of CM was more than 100% which was not consistent with the theoretical results. This may due to the reason that the protein mixture or the separated serum albumin in the test tubes were contaminated with impurities, causing the absorbance measured to be inaccurate as the absorbance of the impurities may also contribute the overall absorbance measured.
As for the separation of haemoglobin and serum albumin using SDS-page, SDS-page is a denaturing electrophoresis as the protein will be denatured by altering the secondary, tertiary and quaternary structure. This produced linear polypeptide chain with same charge to mass ratio. SDS detergent will cause the protein to be negatively charged as it will bind to the hydrophobic region of the denatured polyopeptide and moved to the positive electrode (Clark & Pazdernik, 2010). The separation of protein using SDS-page is based on the molecular size of the protein as the charge to mass ratio is uniform. The distance of protein migrated is inversely proportional to the molecular size of the protein.
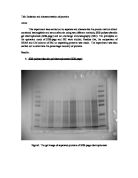
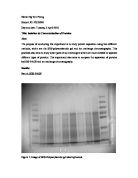
In this experiment, results showed that two proteins were separated by SDS-page with 75.83kDa and 14.35kDa. As stated by Russell et al. (2001), haemoglobin have a molecular size of 15kDa and serum albumin has molecular size of 66kDa.The results were consistent with the theoretical results. This indicated that serum albumin is bigger in size than the haemoglobin. Since SDS detergent denatured the protein, the haemoglobin with 4 subunits was denatured, leaving 4 α or β individual protein subunits which were smaller in size and serum albumin being larger. The small differences of the experimental results and the theoretical result may due to parallax errors in measuring the distance migrated.
Dilutions of the protein mixture with different dilution factors were done. This was done to act as a comparison in order to make sure that the numbers of bands and distance migrated was accurate. It was shown that the distance migrated by each protein for each dilution was about the same. This indicated that the results were accurate and consistent. Standard marker was used as a reference in determining the distance migrated by each protein band. Theoretically, there should be 9 protein bands of standard marker separated by the SDS-page. However, there were only 8 protein bands observed. This may due o the incomplete reaction of the SDS detergent in denaturing protein, causing the SDS-protein complex to be unable to form as SDS detergent was not able to bind to the hydrophobic region of protein. Besides that, it may also due to the length of the gel was not long enough, causing one of the band to be eluted out from the gel. Another reason was that the electrophoresis may take too long time and resulted in elution of last protein band.
Conclusion:
In conclusion, the recovery percentage of haemoglobin using DEAE and CM column were 18.79% and 73.54% respectively. As for the determination of serum albumin, the recovery percentage of DEAE and CM column were 84.03% and 106.43% respectively. This showed that CM is more efficient than DEAE in separating proteins. Exceeding of 100% recovery percentage may due to contamination of impurities. For SDS-page, the serum albumin has molecular size of 75.83kDa and haemoglobin has size of 14.35kDa. Shortage of one protein band of standard marker may due to too long period of running gel and the gel was tooshort causing the bands to be eluted out. The isoelectric points of haemoglobin and serum albumin were higher than pH6 and lower than pH6 respectively.
References:
Clark, DP & Pazdernik, NJ (2010), ‘Chapter 9: Proteometrics’, in Biotechnology: Academic Cell Update Edition, Elsevier Inc., United Kingdom, p. 271.
Hua, ZD, Chen, ZY, Li, YZ & Zhao, MP (2008), ‘Thermosensitive and salt-sensitive molecularly imprinted hydrogel for bovine serum albumin’, Langmuir, vol. 24, no. 11, pp. 5773-5780.
Malhotra, VK (2003), Practical Biochemistry for Students, Jaypee Brothers Medical Publishers (P) Ltd, New Delhi, p.27.
Russell, WK, Park, ZY & Russell, DH (2001), ‘Proteolysis in mixed organic-aqueous solvent systems: Applications for peptide mass mapping using mass spectrometry’, Analytical Chemistry, vol. 73, no. 11, pp. 2682-2685.
Skoog, DA, Holler, FJ & Crouch, SR (2007), Principles of Instrumental Analysis, 6th ed., Canada.
Pre-lab Questions:
-
Isoelectric point of a protein is the pH at which the protein molecules exist as zwitterions which have no net electrical charge (Malhotra, 2003). The protein molecules are not attracted to cathode or anode since they are neutral. At this point, the electrostatic force that causes the protein molecules to repel each other decreases as there is no net electrical charge (Malhotra, 2003).
- The pore size of the polyacrylamide gel is determined by the concentration of acrylamide and the cross-linking agent.
-
This is because some fo the protein do not have negative net charge which causes them to be unable to move to the positive electrode during electrophoresis. Sodium dodecyl sulfate will cause the protein to be negatively charged by denaturing the proteins as it will bind to the hydrophobic region of denatured protein (Clark & Pazdernik, 2010). The tertiary, secondary and quaternary structure of the protein is altered , causing the proteins to be in linear form. As a result, the protein will now be able to move to the positive electrode.
- This is because KCL has a high ioic strength. It can bind to the resin easier and hence elude the bound protein from the resin. Also, KCl can help to preserve the structure of proteins.