If all plants photosynthesised in the same way, then in shadier areas there would be fewer plants, or less well nourished plants.
Some plants have adapted to shadier conditions by having a higher rate of photosynthesis e.g. Dog’s Mercury and bluebells. Plants have evolved in this way as trapping sunlight requires a green substance called chlorophyll, and in shadier conditions where less sunlight gets through the trees’ leaves, the plants need to make the best use possible of that light. To do this they have evolved so that they have a higher rate of photosynthesis. This means they can use what little light they have as best they can and so would prosper in dark areas of woodland, however, in lighter places other plants would grow better as they would be able to use all of the light whereas bluebells can only photosynthesise up to a certain point. I might therefore expect the plants in the old coppice to have a higher rate of photosynthesis, and to be different from the types of plants in more open areas.
Aspect (where the light is coming from) would also affect the plant distribution, so that we might expect there to be more plants on the south side of the hill, as this is the direction from which most of the light is getting to the coppices.
Light is not the only factor affecting the plant growth though. There are many other factors affecting plant growth, such as the soil pH. Different plants prefer a slightly different pH to others, so the types of plants growing in an area with acid soils, would be different to those in normal soils.
Depending on how much water which the plant receives, will also affect the variety of plants, as some plants might require much more water than others, so there might be less of those plants at times of year when there is less rainfall.
The climate and temperature will affect the plants’ growth and also the variety of plants, as different plants are better adapted to different conditions.
A major unnatural factor is human management, as some of the forest we will be studying will be managed i.e. coppices would be planted and looked after by humans. Humans would make sure that the coppice trees were not affected by other woodland plants, e.g. if other plants were to crowd the coppice trees, or steal its light or its water, then the tree might end up dying. Therefore, because of human management, there would not be as much variety of plant life in the coppices as we might expect. Squirrels (an introduced species) also affect the plants, as they eat many of the seeds dropped.
Method
To help with estimating the percentage of species diversity, we have a square (10×10 5cm squares) which is divided into quadrats by string tied at the centre points of each side to make this sort of shape . This makes it easier to estimate the percentage of species diversity in the area of woodland being investigated, as each quarter is 25% of the whole area.
We used this method of estimating the percentage of species diversity in different places on our school field. Making sure that no one was behind us; we threw the square behind us to a random place. The place was random so that our results were not influenced by anything.
Once we had thrown the square, we went over to where it had landed and roughly estimated the percentage of species diversity for the area. We then recorded the types of plant and what percentage area they covered. We repeated this method for different areas, and encountered different results. Nearer to the hedge there were less plants, and the ones which were there were different from the usual grass.
However, this is not a very suitable method for collecting random data, as the thrower of the square is able to see what he/she is throwing it at which might affect his/her results – he might deliberately throw the square at a more interesting place, so we should use a different, more random and safer method to collect our data. In our visit to Nower wood, we chose to use a different method to the previous experiment, in which we were not getting random results as we could see where we were throwing the measuring square (which was split up into quadrats or smaller percentages of the total area).
The new method involves using two axes of thirty metres of tape each. We took two random numbers given to us from our teacher (one for the X axis and one for the Y axis) and using those numbers we came to certain coordinates within the axis-grid (see diagram 1). At the coordinates we set down our square and roughly estimated the percentage of species diversity using an information sheet which told us with pictures the most common woodland plants e.g. x% of bare ground, or y% of russet grass. We used the same person to estimate the ground cover so it would be a fair test (different people’s opinions might differ).
This method was repeated 5 times for both the old and the new coppice. At any one of the random coordinates for the old and new coppice, we used an auger (basically a giant screw) to get a soil sample, which we took from the bottom of the screw, as that is where one would find the main soil composition (see diagram 3). From this soil sample, we were able to obtain the moisture level, pH, and the amount of humus (dead or organic matter) there was in the soil. To find its pH, we put the soil in a test tube, mixed it with a solution and added some indicator. Depending on what colour it was, it was decided what pH the soil had. Once again, the same person had to estimate the pH in the old and new coppice in order to make it a fair test. We also took a light reading using a light box, by pointing it horizontally in the coppice.
We took in to account the soil composition, as otherwise it would not be a fair test. The other factors such as climate, temperature and rainfall, would all be the same, as the old and new coppice are in the same wood.
Results
Analysis
Table of factors and other specifications
Chart 1: old coppice
Chart 2: new coppice
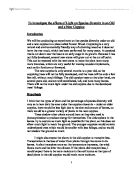
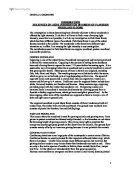
As we can see from the pie charts on the previous page, there was a much greater variety of plants in the new coppice compared to the old. In the new coppice there were 13 different types of species of plant, but in the old coppice there were only 6 different types of plant.
These results support my hypothesis that there is a wider range of plant types in the new coppice – as we can see from the average old and new coppice pie charts; there are many more types of plant in the new coppice compared to the old.
We know that plants make their own food from sunlight, air and water through photosynthesis; the types of plants which are successful in good light conditions would not prosper as much as the plants which are better suited to places with worse light conditions, as they only photosynthesize at a higher rate at a certain level of sunlight. The reason for there being less light in the old coppice than in the new, is because the leaves of the coppiced trees try and succeed in covering as large a surface area as possible so they can photosynthesise as much as possible using the sun’s light. In doing this, they block out light coming from above to the ground, so plants on the woodland floor cannot photosynthesise very well.
There was a much more varied plant range in the new coppice, as the pie charts show, yet contrary to what I would normally expect, there was still a lot of dead or organic matter in the new coppice. With higher light levels, one would expect more plants to have grown in the new coppice, yet the coppices are managed by humans, so this is why other plants have not been allowed to grow.
I do not think that the moisture or pH or even the temperature much affected the species diversity in the old or new coppice. It was a surprise to find that the pH was so different, though that was probably down to bad estimation of the colour of the solution made. The main factor which would affect the species diversity in the coppice would be light.
Evaluation
I think the method we used to carry out our experiment was good. Though our estimations were not very accurate, the quadrat served its purpose, and we were able to obtain a set of results which proved my hypothesis.
I do not think our results were very accurate, however, I do think they were accurate enough for this experiment, as my hypothesis was concerning the species diversity, not the exact amount of each type of plant in the coppices.
If I were to do the experiment again, however, I would try to obtain more results. I would try to analyse the effects of other factors on the variety of species diversity.
The only reason the results did not fit the pattern one might expect of a natural woodland floor is because the coppices were managed, and so there were less of the species than we might expect in the new coppice where there was more light, and more dead or organic matter.
If I were to extend the work we have already done, I would start to make hypotheses concerning the other factors affecting growth in the woodland. I would hypothesise that different species grow in different soil pHs. To prove this, I would have to take soil samples from two different areas which I knew were high or low in pH and I would use the quadrat method to roughly estimate the species diversity.
If I were to hypothesise that different varieties of plants grow in different climates, I would need to compare some of my results with somebody’s in another part of the country, or even in the world, provided the soil composition was at least similar so it would be a fair test.
Nicholas Moore 10Mc Mr James