Secondary data
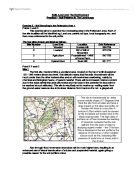
A chart for finger assessment of soil texture was used to determine soil textures in each horizon at the soil sites. A resource sheet showing percentages of clay, sand and silt present in the different soil types was used to find the composition of the soil textures. A 1:25000 ordnance Survey map was used to locate the site and situation of the Ercall (GR. SJ645,097). A cross sectional map of the Ercall hill was also used (see above). The geology of the site determined the sampling method and showed the characteristics of rock variations and soil texture.
Data Processing
The data collected was processed in a variety of different ways :
- Differences in the nature and properties of the soils were recorded on a soil profile with appropriate depths of horizons marked. For each site the depth of soil, pH values, soil texture and colours of the different soil horizons were recorded.
- The ground vegetation cover was recorded on a kite diagram. The percentage cover of different plant species in the quadrats was measured at 10m intervals and recorded in a table next to the relevant plant species
- Oak tree productivity was measured using a gun clinometer reading and measuring tree circumference. A formula was used to determine productivity in terms of volume of timber.
Presentation of findings
The data was presented in a variety of different ways. Soil profiles were drawn for each sampled site with depth and colour of each horizon marked on them. Soil texture was recorded using pie charts showing the percentages of sand, silt and clay found in each soil type. The soil pH values and overall depth of the different soils was recorded on a chart allowing comparisons between them to be drawn. The hillside transect results were presented using kite diagrams for each plant species. This showed the distribution of plant species allowing differences in species cover to be identified. Tree productivity was presented in a table showing tree angle, circumference and timber volume found at each site. Pictographs of tree height and circumference were drawn to scale to show the variations in size and productivity of trees on the hillside.
Outcomes
The first hypothesis stated that no variation would occur in the nature and properties of the soils. However as the data shows each site has a different soil type. The soil depth got progressively shallower further upslope, with the deepest soils forming at the bottom of the hill due to deposition of material from mass movement. The soil texture at each site was also different due to the geology of the area. Site A was a ranker composed of very coarse sand, site B was a podzol composed of coarse sand, site C was a brown soil composed of silt with depositional evidence at the top, site D was a gley composed of sand and clay. The pH also varied. Site B showed evidence of leaching whereas at Site D the change in pH down the horizons was due to lack of leaching in the waterlogged conditions.
The second hypothesis stated there would be no change in ground vegetation cover on the hillside. However as the kite diagrams show there is a transitional zone between species. Tussock grass declined in the increasingly waterlogged conditions at the bottom of the hill whereas plants such as bluebells and brambles which can tolerate these conditions were found here. Bracken was present at site B as it is adapted to the more acidic conditions of the podzolic soil found here.
The third hypothesis stated that oak tree productivity would not change. However as the oak tree productivity data shows the volume of timber decreased upslope. Productivity was best at site C as there were no limiting factors to growth here. Water logging at site D was the limiting factor here, whereas at site B lack of nutrients due to leaching was limiting growth, and at site A the shallow ranker soil was limiting growth as it is prone to drying out and lacks nutrients as the trees are growing on weathered bedrock.
Evaluation
The factors affecting the formation of soils on the Ercall are the differing types of geology and slope processes. The productivity of oak trees and vegetation in general is dependant on soil type. The data collection results are valid enough to be able to draw conclusions and trends from, however human error may have occurred in some being less valid. There may have been inaccurate use of gun clinometers, for example they may not have been aimed at the correct point of the tree each time. Inaccurate use of the BDH kit may have caused some pH values to be incorrect. On the day of data collection it was raining heavily and some rainwater may have contaminated the test tubes affecting the pH values. This investigation would benefit from using a larger sample size that would increase the validity of the results. The use of a stratified random sampling technique would mean that more sites could be tested for each different rock type.
An extension could be carried out and the east facing hillside could be sampled at different times of year to see how vegetation and soil properties may vary. This hillside is made of granophyre rock and so therefore has a uniform geology, meaning that the effect the Catena concept has on soils can be studied. The catena concept looks at individual sections of the hillside as open systems with inputs, throughputs and outputs that determine the soil types found there.