I spent many weeks on browsing, gathering information, printing reports etc. It was huge website, so it was quite difficult to find the required information. I sign up with the website to keep myself updated.
Secondary Sources
Financial Websites
Financial websites like Yahoo! Finance and Reuters were also used to gather key information like industry statistics and company overviews.
I browsed different financial websites to find and note down all the information I could find about the companies. The sites also helped me significantly in writing the economic overview and industry brief sections.
Newspapers and Magazines
Business Magazine like Financial Times and ACCA student accountant Magazine provides extremely useful information about the general economy as well as different market sectors.
I regularly visit the libraries to read newspapers like financial times and different Financial magazines
Libraries & Books
Libraries provide very useful and readily available information. It has several books about different article.
I regularly visited my local library which is quite big library. I also visited British library each week. Many libraries were 24 hours available, so it was very comfortable to accommodate the time.
3. ANALYSIS & PRESENTATION
COMPANY PROFILE:
J Sainsbury plc is engaged in grocery and related retailing. The businesses are organized into three divisions:
1) - Retailing (supermarkets, convenience and online
2) - Financial services (Sainsbury’s Bank joint venture), and
3) - Property investments (British Land joint venture and Land Securities joint venture).
As of March 31, 2009, the company comprises of 502 supermarkets and 290 convenience stores. It jointly owns Sainsbury’s Bank with Lloyds Banking Group and has two property joint ventures with Land Securities Group PLC and The British Land Company PLC.
Sainsbury has opened 13 new supermarkets during the fiscal year which ended March 31, 2009 (fiscal 2009), including two replacement stores, and it has completed 21 supermarket extensions and 13 refurbishments. On March 4, 2009, it announced the acquisition of 24 stores from the Co-operative Group comprising 22 Somerfield branded stores and two Co-operative branded stores. On the February 18, 2009 the Company acquired TownCentre Retail (Bisector) Limited.
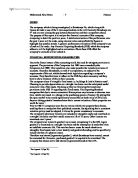
ECONOMIC GROWTH AND RETAIL INDUSTRY:
Before the analysis and further drilling down the topic it’s important to know the overall economic environment and retail sector performance particularly in UK, which will aid in understanding exactly where the company stands in the sea of competitors and how well they have performed against the wind.
Since 1982, UK has only once registered negative GDP growth over an entire year, with a 1.4% fall in 1991. The period between 1989 and 1993 demonstrated a visible dip, but in all other years the measure has been fairly stable, fluctuating between 2% and 4% for the most part. That was up until last year, when thecredit crunchhit and the measure for 2008 fell to 0.7% - the performance during the first half of the year just about keeping it in positive territory. However, this year the International(IMF) is predicting a 4.4% drop, which would represent the biggest post-Second World War fall in the UK by over 3%.While the pace of decline in GDP slowed from the 2.4% seen in the first three months of 2009, the economy has suffered a cumulative contraction of 5.7% in the last five quarters.
Ref 1 GDP growth: a false dawn for UK economy?
Key Findings:
- Online retail will emerge as an important mode of selling.
- Each Supermarket in UK has its own consumer class.
- Top four Supermarkets hold major market share (almost 75%) in UK.
- Increasing buying power of retailer remains the major driver for the industry.
Ref 2 UK Supermarket Analysis (2007-2010)
UK economic recovery is underway, albeit "fragile and in its early stages", according to Bank of England Monetary Policy Committee (MPC) member Andrew Sentence.
Ref 3 UK economic recovery underway, says BoE's Sentence
RATIO ANALYSIS
Singlemost importanttechniqueoffinancial analysisin whichquantitiesare converted into ratios for meaningful comparisons, with past ratios and ratios of otherfirmsin the same or differentindustries. Ratioanalysisdetermines trendsand exposesstrengthsor weaknesses of a firm.
Ref 1: Definition
A-OPERATIONAL ANALYSIS:
From recovery to growth Sainsbury’s have performed exceptionally well in troubled economic conditions, under the leadership of Justin King, with nearly half of the market capital as compared to M&S. Since 2007 the sales have grown to nearly 5.7%: £20,383m as compared to £19,287. M&S group revenue have risen only 0.4% to £9,062.10m since 2007.
SAINSBURY’S M & S
Income Statement
Mar-09
Mar-08
Mar-07
Revenue
18,911.00
17,837.00
17,151.00
Operating Profit/(Loss)
673
530
520
Profit Before Tax
466
479
477
Profit After Tax
289
329
324
Income Statement
Mar-09
Mar-08
Mar-07
Revenue
9,062.10
9,022.00
8,588.10
Operating Profit/(Loss)
870.7
1,211.30
1,045.90
Profit Before Tax
706.2
1,129.10
936.7
Profit After Tax
506.8
821
659.2
It has been a turbulent two decades, since the grocer had its crown as the UK’s largest retailer stolen. It has been the subject of endless bid speculations even by M&S and yet it has risen each time from the ashes.
It was in the late 1980s when J Sainsbury last reported sales figures as strong as last week's. Margaret Thatcher was Prime Minister, the Berlin Wall was still standing and Andy Murray was a toddler.
UK’s third largest retailer, with a 16.3% of the sector, posted a better result in 2009 than expected by the analysts with a spook hike of 11.3% in annual profits as compared to the last years. The growth is less than half of last year’s 28% surge, profit hike seen at rival Tesco(4.3 % rise), 7% rise in Morrison’s while a slide decrease of 29.4% in M&S.
The growth in number of customers, i.e. 18.5m a week, ringing bells on the doors of rival market leader Tesco, which is 2nd fastest annual growth behind Morrison’s at the expense of Tesco, under the TNS world panel market share data.
The underlying profit before tax rose by 11.3% whereas due to underlying net finance cost the net profit before tax have decreased by 2.8%, as compared to 40% decrease in M&S profit before tax.
After the biggest contribution by the LFL sales growth of 4.5%, new spaces have added another 1.6% to the slice against the decrease in Easter (0.8%) and Disposal on closures (0.6%) to make a healthy retailing sales momentum of 4.7%.
Online operations have seen a growth of 20% in online grocery shopping thanks to the IT enhancement in areas such as supply chain and replenishment, the retailer said in its results. The more simplified in store and web processes have played an important key role in its growth.
The company had its best ever online Christmas sale this year, contributing a hefty 27% growth over the three month period to 3rd January 2009. Under the tough economic conditions, its continued investment in price, promotions with universal appeal, and wide customer based??? gave it a platform to continue its progress.
Sainsbury’s Bank contributed a £4m share in underlying post tax profit as compared to £3m loss in 2007/08 because of strong cost management, lower bad debt charges, and continued growth in investment.
Property investment saw a big swing in its growth due to the better portfolio of its British Land and Land securities, adding £9m and £3m respectively as compared to £16m profit from its joint ventures. The company is expecting a small growth in its Banking sector due to turmoil in financial sector and a expecting similar level of growth from its JVs. It has earned £57m profit on sale of its properties as compared to the £7m in 2007/08, including the eight supermarkets that were sold at an average yield of 5.2%. M &S profit on property disposals was only £6.4 (2008:£27.0m)
Reduced finance cost of £5.8 as compared to £5.9 earlier on and a reduced tax rate of 29.1% as compared to 2007/08’s 30.9% has helped the swing and is expected to continue during the year. However, M&S funding cost was marginally up by 6.1% and the net finance cost was up by £82.3m compared to last year.
B- PROFITABILITY ANALYSIS:
It’s a useful measure of revenue and cost, which helps to determine the investment decision. The length of time required to repay the initial investment can be a critical factor.
SAINSBURY’S M & S
Sainsbury’s 500 superstores and 300 convenience stores have been performing strong over the past few years with its consistent approach towards its operation and growth expansion. From its 15.1% increase in operating profit, the underlying operating profit margin has increased by 26bps. Well controlled direct expenses have helped to maintain a steady average of 5.98% over the past three years, as compared to 38.25% of M&S, even though the operating margin was expected to rise by 12-30bps with the help of stronger sales and smaller proportionate contribution from lower-margin petrol sales. The rising grocery prices have boosted sales at Britain grocers for nearly over a year but food price inflation slowed to 1.6% in September, the slowest annual increase since may 2006.
The net profit margin and interest cover are quite consistent with an average of 1.75% & 4.61% as compared to healthy 7.46% & 8.18%, respectively of M&S and could help the investors build their confidence.
However, Sainsbury's underlying retail profit margin -- up 26 basis points to 3.26 percent -- lagged rivals, due largely to its higher rent bill. Tesco's UK trading margin is 6.2 percent. The point is salient. Tesco's margins are 6.1pc whereas Sainsbury's margins are 3.3pc. Given the vast volumes of eggs, frozen peas, T-shirts and bread that supermarkets sell, margins are hugely important to a company's profitability.
“Mr. King argues that comparing Sainsbury's and Tesco's margins is an "apples and pears comparison".
Profits from Tesco's international business alone were £709m last year, compared to £540m for all of Sainsbury's. This year, Tesco is on track to open around 6m square foot of new space overseas. Most startlingly, Tesco's share of the UK grocery market is 30.8pc. Sainsbury's is 16.3pc.
UK's largest supermarket also has retailing services business – comprising its bank and telecoms arms – that turned in profits of around £400m last year. Profits in this division will grow to £1bn over time.
"Investors get so much more than a UK grocer when they buy Tesco," said one observer.
C- FINANCIAL STRENGTH
Financial strength is a measure of business risk; the stronger a company is from a financial prospect the less risky it is. It can be measured by Quick Ratio, Current Ratio, Long term Debt/Equity, and Total Debt Equity ratios.
SAINSBURY’S M&S
The current ratio for Sainsbury’s has dropped nearly 30% to 0.54 since 2007 as compared to 13.2% increase in M&S ratio and Industries (0.96). Due to stock the quick ratio has dropped by 41.17% as compared to the18.91% increase in M&S’s & industries (0.78). It does show its aggressive strategy for the operations and working capital management, which could prove to be risky for the company over the long run. The retailer has also disclosed to a rise of $445m to accelerate growth drive and deliver extra trading space of 2.5m sq ft. by March 2011. If we further drill down the breakdown of current assets and current liabilities of both the companies, we could have a broader view about the Financial Directors strategy, to facilitate the company’s objectives.
Its gearing control shows a better managed picture of its finances and gives a better debt/equity of 0.47 as compared to the doubled (M&S: 0.92) average over the last three years, which shows that most of its funding was by short term debt finance.
The company has better capital structure as compared to M&S at the moment, showing half of M&S’s total debt/ equity ratio and it demonstrates that the cost of capital is less in the form of interest but attractive signal for the investors to squeeze the more of its return and better control over the long run. The choice of capital is driven by the objectives and time duration for the projects. Sainsbury’s growth plan could prove more efficient by equity finance as compared to debt finance over the long run.
The working capital management is a vital tool for any company to maintain its profitability and liquidity equilibrium. After a scoop of 11.3% profit, Sainsbury’s has shown a decreased cash level to £-77m as compared to £-2m in 2007. M&S has dropped itself into deficit after two positive cash for a continuous two years until 2008 to £-235.41. Sainsbury’s has arranged its cash from debt equity which can provide financial flexibility, speed up growth, maintain its balance sheet strength and invest in long term opportunities, bearing in mind that it is more riskier but under better management the cost could be of the same value, if the shareholder value is not ignored.
D - MANAGEMENT EFFECTIVENESS.
It’s an evaluation technique to judge the effective utilization of resources given to management. It can be measured normally from, Return on equity, Return on Assets, & Return on Investment Ratios.
Lower ratio signals alarm for investors to reconsider their choice.
SAINSBURY’S M&S
Sainsbury’s policy of equity finance and short term debt finance has thrown it off the picture by M&S’s figures of Return on Equity: 39.01 as compared to its 7.06 (average over three years). Looking at the bigger picture, it’s in a more stabilized and on well performing acceleration gear as showing more close figures to industrial : 4.05, sectors: 7.43, and S&P500: 8.73. The high debt/equity ratio of M&S (from Figure 5 above) shows a clear idea of its good return on equity ratio, whereas Sainsbury’s management is more concerned to keep their investors happy and in good health. The return on Assets % is showing pretty consisting move over the past with an average of 3.04. The major contribution is by current assets turnover (34.50% growth) where as fixed assets showed only 0.26% decreases as compared to 40.6% decrease in total assets turnover. M&S showed a sluggish performance in effective utilization of fixed Assets: -18.4% and current Assets: -35.7%, over the past three years.
Comparing both companies with their industrial average: 1.66, sector average: 3.29, S&P500: 3.65 Sainsbury’s, 3.04 is more close to the sector average as compared to M&S, 10.84. It is showing that the policy of the company has much improved over the years and the company is well aware of their targets and has better plans as compared to M&S.
Return on Investment is one of the core tasks to be managed by the Financial Director of the company. It’s a measure of efficiency; showing that the better the return the better the management was in utilizing the resources. As from Figure 7 Sainsbury’s return on investment has decreased by 10.32% to 3.97% as compared to M&S, 10.01% a 46.72% decrease (industry; 2.87%, Sector; 4.55%, S&P500; 5.0). Again the company is performing well in the sector and better than the industry. It could be due to the major finance source as equity and better operations management, as compared to M&S which is not heavily relying on growth or finance further capital, which could result in lowering the working capital of the company.
Over the three years average and performance, M&S is more riskier and has no pet behavior of its returns, as compared to consistent results by Sainsbury’s, which is a key indicator for the investors and could enhance the confidence and built a long term relationship. This has already set a platform for Justin King to announce its expansion plans.
E - DIVIDEND INFORMATION
Typically mature, profitable companies pay dividends. However, companies that do not pay dividend can’t be considered without profits. The company should keep the profit to invest in other opportunities available elsewhere, if they are more important for the company’s growth. For these reasons only a few of the growth companies pay out dividends.
The progression of Microsoft through its life cycle demonstrates the relationship between dividend and growth, where Bill Gate paid no dividend while its brain child was growing, but reinvested all of its earnings to fuel further growth.
SAINSBURY’S M&S
As per the data above, Sainsbury’s has pleased its investors by accelerating their payout ratio (average of 64.28) nearly by 36.09% since 2007, as compared to 14.94% of M&S. Its investing and finance policy enabled to enjoy a steady momentum of 23% over three years for its dividend per share, which was mainly due to the capital structuring and relying on equity finance. The Board proposed a final dividend of 9.6 pence per share (2008: 9.0 pence), & has announced its interim dividend (2009/10) to increase by 11% to 4p per share, to boost the investor’s confidence in the company.
Dividend yield has grown with a great positive progress of 133.3% since 2007 over the last three years, even though its not as healthy as M&S’s 6.7% in 2009. However, the company has performed well against the industry’s (0.03), sector’s (0.14) & s&p500’s (1.51). While the growth rate per share for dividend has dropped down more than half of 2008’s, the last five years average for industry (5.43) & sectors (8.51) it looks more attractive yet.
21-Mar-09
22-Mar-08
24-Mar-07
Dividend Yield (%)
4.2
3.6
1.8
Dividend per Share Growth (%)
10
23.08
21.88
Dividend cover
1.67
1.63
1.51
The dividend is covered 1.67 times (2008: 1.63 times) by underlying earnings in line with Sainsbury’s policy of providing cover of between 1.50 and 1.75 times which is 6.37% higher than M&S’s dividend cover in 2009:1.57. Over all, the company looks on track to achieve its goals and corporate objectives which was adopted by Tesco a decade back.
F - PER SHARE DATA ANALAYSIS
These are the indicators for the investors to measure and judge the financial health of a company. It is really important to bear in mind, that these are mostly based on general rules. It is considered as a prudence practice to look at the historical data and to use it for future decision making.
Before the analysis of dividend it is important to view its performance on LSE against its competitors, M&S and, market leader, Tesco.
SAINSBURY’S M&S
Sainsbury’s serene progress through the downturn continued, which helped to push the revenue up to £20.3bn even though net profit slid due to loss on property portfolio. ‘Taste the Difference’has helped to increase its revenue with low cost and persistent approach towards its margins. Over the years its earning per shares (EPS) has showed a steady growth, even though it dropped a little in 2009. Its (0.63) showed a better performance against M&S: 0.01, on three years average.
Its like-for-like sales growth of 4.5% helped to achieve good figures for its sales per share; 10.73 (2007:9.97), as it has gone up by 7.63% as compared to 14.97% increase in M&S; 5.76. It shows that the operations and cost were well controlled by the Sainsbury’s management.
The book value showed a bit sluggish behavior as compared to improved performance by M&S. Due to the growth and expansion plans and heavy investment it has faced a bit of cash flow problems over the last year, which has slid to 0.16 by 18.8% (2008: 0.19). Its price to cash flow of 7.27 shows a better performance against the industry’s 2.13, sector’s 3.2. Moreover, its cash performance over its shares shows a better picture as compared to its rival M&S even though it has dropped to 0.39 (2008: .41), a 66.67% decreased since 2007. It is due to the further increase in outflow of 11.12% in its investing activities, and a 77.72% in its financing activities, as compared to last year. Overall the company demonstrates a better steered and well controlled balance of funding and management of finance which enabled it to plan ahead and grasp the growth opportunities available in the market that competitors are scared to take.
BUSINESS ANALYSIS
Business analysisis a discipline of identifying business needs and determining solutions to business problems. Solutions often include a systems development component, but may also consist of process improvement or organizational change or strategic planning and policy development. The person who carries out this task is called abusiness analystor BA.
Business Analysis Techniques
Investigation into theoperationsof abusinessto expose thecausesbehindtheresultsachieved and the effects of those results on the business.
Some of these techniques include:
a- PESTLE
b- CATWOE
c- DE BONO 6HAT
d- FIVE WHY’S
e- Moscow
f- VPEC-T
g- Porters Five forces model
Ref 5: Business Analysis
Due to the words constraints and objectives scope, i will limit my vigilant view through SWOT analysis.
STRENGHT,WEEKNESS, OPPORTUNITIES,THREATS(SWOT) ANALYSIS:
It’s an appraisal technique for the business to know where it stands overall. I will try to summarize the performance of Sainsbury’s past and try to visual its future according to its corporate objectives and its sector, internally (For strength and weaknesses) as well as externally (For threats and Opportunities).
During the overall reading and research of the company by available source, I found the following key finding about the company, and believe that they are working well on their five years of focus to achieve its Corporate objectives towards “Recovery to Growth from 2007 to 2010” will be successful,
Because it has:
1. Strengths to Utilize From:
v A long 140 years history of serving its customers, a geographical spread of 502 supermarkets, and 290 convenient stores, dispersed to acquire 16% of total market share with 11 stores in Northern Ireland.
v A well diversified business divisions of Retailing, Financial services, and Property investment
v Customer focused approach to provide improve products and innovation to services to retain loyalty and well known brand, built on heritage of providing healthy, safe, fresh and tasty food.
v Over 18m customer’s transactions a week, with a range of 30,000 good products at fair price to offer, offering an internet based home deliver to 88% of UK shoppers, with its niche approach.
v A healthy growth rate of 4.5% in its LFL sales and 5.7% overall sales and a 11% growth in profit. To provide a dividend of 13.2p and a cover of 1.67 for the investors
v Investing and operating activities and management are improved and efficient, to earn healthy profit before tax of £543m, underlying basic earnings 22.1p (2006:14.7), operating cash flow:£1,206 (2006:£830)
v In October 2008 the Institute of Grocery Distribution presented us with its ‘Award for Consumer Understanding’ for delivering innovative and appropriate solutions for customers.
2. Weaknesses Required To Overcome:
v New channel of business (Non-food online) a problem child could use the resources of the company and may cause trouble for the rising star (Online-Food home delivers service) to continue growth due to funds being segregated, or may be reduced.
v Loss from the joint ventures (even after completing £750m of complete property transactions), increase in finance cost, higher depreciation expense and decrease in finance income, shows a need for improvement in financing and property legs of the business.
3. Opportunities required to exploit to:
v Increase its products and business portfolio with 20% increase in clothing-TU, £4m post-tax profit in banking could help to capture more share of the sector.
v Increase customers & Market share by additional 150 stores with a growth rate of 5% till 2010/11.
v Online-Food home delivery has shown a good progress of 25% annualizing at over £500m, which can be cash cow in the future.
v Promote its RSPCA freedom food chicken (130%) up & its 1 per cent fat’ milk, (launched in April 2008), as 2.5m UK households already consuming that, to accelerate till as well as the products encashment.
v Increased trading intensity per Sqf to £20.01 (£19.30:2006/7), can help the company to pack its shelves with new products and make it more spacey to reach maximum hands and fill more baskets.
4. Threats which Required
v Concentrating only on five key areas of the business, i.e. : great product at fair prices, accelerating the growth of complementary non-food ranges, reaching more customers through additional channels, growing supermarket space and active property management. It could be not sufficient enough to meet interest of all stakeholders involved and could involve strategic risk as well.
v A well diversified team of 150,000 colleagues are hard to monitor for a one focused objective, and could lead to performance risk and goals may not be up to desired levels.
v Economic downturn has challenged the household’s disposal income, and unemployment resulting in an increase demand for value from customers, which could affect the cost and sales of the group.
v Increasing awareness of environmental factors has forced the company to reduce packaging and waste and energy usage across the stores, which could affect the performance and could increase the cost in development and innovation.
v Funding the corporate objectives are key to success, which can be hindered by the interest and foreign currency risks, as well as the wrong investing or financing policies, which are controlled by a professionals in treasury department and are reviewed by internal auditors.
v The internal risk of fraud and unethical activities by the employees to attain self satisfactions, could increase the cost of monitoring and control and would require more staff for internal auditors and more equipment cost to control the activities.
v Due to the food industry, its always risky to have health and safety compliances and strict measure to keep legal threats and incidents away from the company.
v Customers experience and high quality required more IT involved, which can cause a infrastructure and process engineering risk to the company and enhance the cost of training and development.
v Other type of risks involved are, pension risk , due to involvement in pension arrangement (benefits schemes) and second could be, Product safety.
ETHICAL AND CSR ASPECTS, To BEAR IN FOCUS!
v In February 2009, Sainsbury’s was the first major super market who stopped selling caged hens eggs.
v Committed to provide zero food wastage to landfill by the end of 2009, and reduce CO2 emissions, already saved 53,000 tones of CO2 by only 200 stores in 2008.
v It is Largest Corporate partner for Comic Relief Charity, donating over £40m in last 10 years.
v Donated £70m worth of sport equipment for Active Kids, since 2005.
v Over 2000 colleagues, participating in YOU CAN, company’s umbrella brand to support jobs and opportunities.
Ref 6: Over all view of Sainsbury’s
5 CONCLUSIONS & RECOMENDATIONS:
Sainsbury’s have learnt lesson from its past, and from over all analysis of financial and business aspects its look like company have progress well over the last years, and looking solid in fixing its fundamental parts of its operations placing business on a strong position to accelerate. Its heavy spending and media war, campaigns and advertisement have enabled the company to boost is sales by 4.5% excluding fuel.
Its universal customers appeal and continued investment in price & quality have proved key to its progress, and offers to buy deals at best price. Its variety of product range, offering flexibility to choose from, have enabled growth in customers to 18m a week helping till accelerate fast.
Price perception have improved with great products and fair price on shelves and continuous investment in price, promotion and marketing activities.
Investing in five core areas, (corporate objectives) have set a vision for the company, helping growth and provide great opportunities to progress in the future.
It is concentrating its online business leg to help to generate more revenue, which has increased in growth by 25% , which could increase it market share overall and create new competitors to expand its growth.
Its growth plans involve heavy investment, which could prove risky in such a unstable economic conditions and turmoil for the sector and industry, where other competitors are focusing on their existing operations.
Sainsbury’s performance has rung the bells on market leader Tesco, and other competitors with strong on board performance, but still Morrison is the market leader with an 8.5% growth in October 09.
6 BIBLOGRAPHY
Electronic Resources
1- GDP growth: a false dawn for UK economy? http://www.thisismoney.co.uk/news/article.html?in_article_id=492114&in_page_id=2
2- UK Supermarket Analysis (2007-2010) http://www.just-food.com/store/productprint.aspx?id=53975
3- UK economic recovery underway, says BoE's Sentence http://www.ftadviser.com/FTAdviser/Regulation/Regulators/Treasury/News/article/20091117/437ff4e8-d379-11de-8eea-00144f2af8e8/UK-economic-recovery-underway-but-relaxed-monetary-policy-to-continue-Andrew-Sentance.jsp
4- Shares, dividend and earnings performance over the years on LSE market. http://markets.ft.com/tearsheets/financialsSummary.asp?s=uk:SBRY
5- Business Analysis http://www.businessdictionary.com/definition/business-analysis.html
6- Over all view of Sainsbury’s http://www.j-sainsbury.co.uk/ar09/businessreview/principalrisks2.shtml
Key Progress and Achievement http://www.j-sainsbury.co.uk/ar09/businessreview/keyprogressandachievements.shtml
Key financial indicators: http://www.j- sainsbury.co.uk/ar09/businessreview/keyfinancialperformanceindicators.shtml
7- NOTE: Financial data was acquired from : This is money http://investing.thisismoney.co.uk/cgi-bin/digitalcorporate/thisismoney/security.cgi?ticker=SBRY&action=financials&sub_action=fundamentals&username=&ac=
Financial highlights and industry averages: http://www.reuters.com/finance/stocks/ratios?symbol=SBRY.L
Books
FTC Foulks Lynch 2005 – Drafting Financial Statement Unit 11
FTC Foulks Lynch 2004 - Financial Reporting
ACCA – F9 Financial Management
Read more:
Right now I am trawling through the FTSE 100 and giving my verdict on every member of the blue chip index.
I hope to pinpoint the very best buying opportunities in today's uncertain market, as well as highlight those shares I feel you should hold... and those I feel you should sell!
I'm assessing every share on five different measures. Here's what I'm looking for in each company:
-
Financial strength: Low levels of debt and other liabilities
-
Profitability: Consistent earnings and high profit margins
-
Management: Competent executives creating shareholder value
-
Long-term prospects: A solid competitive position and respectable growth prospects
-
Valuation: An under-rated share price
A look at J Sainsbury
Today I'm evaluating J Sainsbury (LSE: ) , a major food retailer that also engages in financial services and property investments, which currently trades at 333 pence. Here are my thoughts:
1. Financial strength: Free cash flow has been uneven during the past five years, ranging from 350 million pounds to 5 million pounds, while capital expenditure has been rising and eating up cash flow. Nevertheless, Sainsbury's balance sheet remains solid with low net gearing of 36% and sufficient interest cover of eight times. Also, the group has 739 million pounds in cash and cash equivalents, more than enough to cover debts maturing during the next five years.
2. Profitability: Sainsbury's performance has been largely unexciting for the past decade, with average annual sales growth of 3% and earnings growth of 7% per year. The average operating margin at 3% has been low compared to Tesco at 6% and William Morrison at 5%, while return on capital employed has been pedestrian at 8% per year.
However, Sainsbury's performance has significantly improved during the last few years, with sales growing at 6% and earnings at 9% per year, driven by the rapid growth of non-food sales, which have advanced three times faster than food sales.
3. Management: Since CEO Justin King took charge in 2004, sales have grown from 15 billion pounds in 2005 to 22 billion pounds in 2012, while margins have expanded from 2.2% in 2005 to 3.5% in 2012. In addition, operating profits have increased from 345 million pounds in 2005 to 827 million pounds in 2012, and dividends have compounded 11% annually from 8 pence per share in 2005 to 16 pence per share in 2012.
4. Long-term prospects: J Sainsbury is now the third-largest food retailer in the U.K. after Tesco and Wal-Mart's Asda, and its market share of more than 16% is the group's highest in nearly a decade. The general merchandise, online grocery, and convenience-store divisions have potential and could be areas for growth. However, without having any clear sustainable competitive edge and with the economy expected to contract during the next few years, improving margins and further returns on capital will be difficult.
5. Valuation: At a forward P/E of 11, I think Sainsbury is already trading around fair value and is a little bit more expensive than Tesco and Morrisons, both of which have a P/E of 10. However, Sainsbury looks cheaper, trading at only 1.1 times tangible book value and 0.3 times sales. Plus, according to the company, the market value of its properties could be more than 2 billion pounds greater than their accounting value, which means the share may actually trade at a discount to tangible book value.
My verdict on J Sainsbury
Sainsbury's performance during the last few years has been promising, but I am skeptical as to whether the firm can maintain this trend.
Margins and returns on capital have been improving but still remain low, and given that the business operates in a highly competitive industry, I would wait for a clearer indication of a sustainable competitive advantage -- that is, margins and returns on capital increasing further -- before buying in.
Besides, Sainsbury's share price has risen 17% during the last two months and is already trading near its 52-week high. While a 5% yield remains attractive, I believe the company is now reasonably priced and, without sufficient margin of safety in my valuation sums, I would not be comfortable owning it given the issues mentioned. However, I would consider buying if the share price fell below 300 pence.
So overall, I believe Sainsbury at 333 pence looks like a sell.