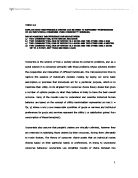
Supply Curves
The supply curve labelled SS in the figure below shows the amount of a good one or more producers are prepared to sell at different prices.
Movements Along and Shifts in Supply Curves
A change in price never shifts the supply curve for that good. In the diagram below an increase in price results in a movement up the supply curve. The increase in quantity supplied from Q1 to Q2 is sometimes called an expansion in supply.
A supply curve shifts only if there is:
- A change in costs.
- A change in the number of goods in competitive or joint supply.
- Some unforeseen event which affects production.
In the diagram below an increase in supply shifts the supply curve to the right.
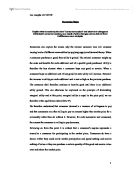
There are some simple assumptions concerning the behaviour of consumers and producers. The theory of consumers demand (how consumers make purchase decisions) assumes that consumers are rational, that is, they want to make the decision that will give them the greatest satisfaction, known as maximising their utility. The optimal choice for a consumer, therefore, is that choice among the available options that will enable him or her to maximise utility. The options available to the consumer are determined by his or her purchasing power (a function of income and access to capital, including credit), and the prices of goods and services available. Given the information available concerning these options, the consumer’s utility-maximising choice will depend on his or her preference patterns (how the consumer believes that the different combinations of goods and services will effect his or her total utility).
These assumptions can predict how consumers and producers are likely to behave. There are many factors of supply that can affect the price of products, thus affecting the demand for a good. Laws can be passed that may allow, regulate, or disallow production. More relevant today are the laws that affect the costs of operations, thus affecting supply. The dramatic weather of the past decade has significantly affected farmers and other producers. For most producers, improved technology allows for more production or cheaper costs, therefore they will be willing to produce more, and increase supply. Occasionally technology costs more than the producer can afford, causing him/her to shutdown.
Demand Curves
Movements Along and Shifts in Demand Curves
A change in price never shifts the demand curve for that good. In the figure below an increase in price results in a movement up the demand curve. The fall in the quantity demanded from Q1 to Q2 is sometimes called a contraction in demand.
A demand curve shifts only if there is a change in income, in taste or in the demand for substitutes or complements. In the diagram below a decrease in demand has shifted the demand curve to the left. The new demand curve is D1 D1.
Factors like corruption can also affect supply. In some developing countries it is possible to be more cost efficient than its rival and charge lower prices, but not be able to compete as its rivals have good connections with the government. I have already identified price, advertising, packaging, and brand name as factors which determine the level of demand for a good in the market, and how some supply factors can affect the demand for a product due to it increasing the price or reducing the price for the goods and services. However, there are other factors which can and do effect the demand for a good, which the firm does not have influence over, and they include the following.
Personal income, as incomes rise consumers are able to purchase products they were previously only willing to buy. Thus the demand for what we call Normal Goods increases with an increase in income levels in the market. However, demand for goods that are perceived to be inferior – Inferior Goods will decline as people become able to buy goods of a higher standard. For example the ‘Bargain Basic’ range of products offered in Supermarkets, and targeted at people with low incomes, will see a fall in demand if income levels rise, enabling people to buy the Normal Good equivalent of the product.
As income levels do not rise evenly across a nation, instead what is often seen is a redistribution of income, from perhaps the rich to the poor. If wealth were redistributed in this way those on higher income levels would see their income levels reduce, and thus reduce their demand for Luxury Goods, whilst those on lower incomes would, experience an increase in income, and thus increase demand for Normal Goods and reduce demand for Inferior Goods.
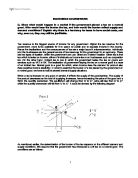
If there is an increase in technical progress it allows firms to produce more goods with less factors of production or cheaper factors of production, which lowers the cost of production . This enables firms to produce the same quantity at a lowered price or a larger quantity at the same price. Which results in an increase in supply. This shifts the supply curve rightwards. This impact of new technology is shown in the graph below as a shift from S to S1.
This results in a new equilibrium, which leads to the market clearing at a lower price P2, and a larger quantity Q2. This is depicted on the diagram below.
Price
D S S1
P1
P2 O
Quantity
Q1 Q2
So a steady increase in income per head and an increase in technical progress would result in an increase in supply and demand. Where both the supply and demand curves will shift rightwards. This leads to a new equilibrium, (O) where S1 crosses D1, leading to an increase in quantity and an increase in price.
Price S
D1
D S1
P2
P1 O
Quantity
Q1 Q2
Changes in tastes and fashion can change the demand for products considerably because of the changing tastes of consumers and fashion. For example, the market for beer can go out of fashion if consumers believe that, it is more fashionable to drinks spirits or not to drink at all, and vice versa consumers might decide that beer is more fashionable than spirits. Some industries like clothing and furniture are more affected by it than the others. Today, increasing numbers of consumers are demanding goods that are kinder to the environment and animals, and foods that are healthier. A rise in the number of people in a country, means more food, clothes and many other commodities are needed. A rise in the population will therefore increase the demand for many commodities. The average age of the population can have an impact in the demand for products in the UK and many other developed countries are rising as both birth rates and death rates fall and remain low. Older people tend to save more, spend more on household goods and prefer wine and spirits to beer.
The expectations of future prices effects the demand of a product, because if you know the price of a certain product will rise, you will want to buy more now, so that you can avoid paying the higher price in the future. So demand will increase in response to this information. Likewise, if you know the prices will drop, you are likely to buy less now, waiting to buy when the prices have fell.
If it is easier to borrow money (Credit cards have lower interest rates or are easier to obtain), Demand increases for many products. Since consumers are able to purchase the products that they couldn’t buy before, their means have in a sense increased. On the other hand if it is harder to borrow money, consumers will have less ability to buy, so demand decreases.
Compliments affect the demand for products, as some products we buy need other things, or accessories, to go with them. For example cars need petrol, compact discs need disc players, bread may need butter. If there is a fall in the price of compact disc players, the demand for compact discs possibly will increase. Some products, however, are substitutes for each other they also can cause movement for demand, as certain purchases can replace the want of another good or service. For example, margarine may be a close substitute for butter for a number of people. An increase in the price of butter may cause people to switch to buying margarine so that the demand for margarine will increase. Thus either of the following will increase demand:
Price of a substitute good increases Price of a compliment good decreases
And either of the following will decrease demand
Price of a substitute good decreases Price of a compliment good increases
I hope I have illustrated the variety of influences that affect the demand for products, both in areas that the firm play a part in, and ones that go beyond the firm’s scope.
Bibliography
M.L. Katz and H.S. Rosen, Microeconomics, Third Edition, Irwin, McGraw Hill, 1997
R. Roseman, Study Guide to Accompany Microeconomics. Irwin, McGraw Hill, 1997.
J.M. Perloff , Microeconomics, Second Edition, Addison Wesley Longman 2001
W. Nicholson, Microeconomic Theory: Basic Principles and Extensions, Seventh Edition, Dryden Press, 1998
H.R. Varian, Intermediate Microeconomics: A Modern Approach, Fifth Edition, Norton, 1999