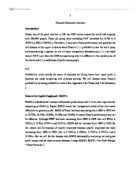
Stock Turnover
This ratio discloses the number of days, these companies’ stock remain in the business. It is very important in analysing a company in retail business. It determines the efficiency of management in selling out the available stock, which is 12 days in case of Tesco Plc and 21 days for Somerfield. This shows that Tesco is much efficient in turning its inventory into cash in just 12 days as compared to Somerfield taking 21 days to finish its stock.
ANALYSIS FOR INVESTORS
Common shareholders and potential investors in common stock first look at a company’s earning record (Meigs & Meigs, p934, 1993) as it can most effectively figure out a company’s potential and capabilities as an investment. A company’s earning record may be assessed from the Earning per Share and the dividends it pays to its shareholders. The following ratios can be used to evaluate the attractiveness of both Tesco Plc and Somerfield’s shares from the investor’s point of view:
Earnings per Share (EPS)
The investment is generally made in the shares or stocks of the company; therefore Earning per Share determination is essential in the assessment market value of a company’s shares. Tesco’s EPS as per company’s annual accounts is 17.72p, offering more investment potential for stockholders than the Somerfield’s 12.1 according to its annual accounts. It shows that Tesco is utilising the investor’s money and paying them per share earnings better than Somerfield, which in turn, fosters the investors’ trust in the company’s potential.
Dividend Yield
It is yet another way to assess the investment potential in a company’s shares, as it is an important matter for the investors whose objective is to maximise the dividend revenue from their investments. Tesco offered 2.53% dividend yield to its stockholders that is quite a satisfactory situation for the investors, but Somerfield’s 1.44% does not bear much attractive potential for the investors interested in dividend revenue as compared to Tesco, once again showing that investors would be much interested to invest money in the shares offered by Tesco rather than the Somerfield.
ANALYSIS FOR LENDERS- SHORT TERM
The short-term lenders of a company are interested in the long-term stability of a business. They look for a company that can successfully run the business with credibility i.e., be able to pay its short term liabilities without involving much hassle. The following ratios would be used to evaluate Tesco and Somerfield‘s long-term credibility for the short-term lenders I-e; a banker, a trade creditor etc.
Current Ratio
The current assets are required to meet the company’s debts as they become due. The current ratio indicates this relationship and for Tesco and Somerfield both from retail industry, it shows that both of these companies can quickly turn its inventory into cash, but good working capital is always required to meet a company’s short-term liabilities and expenses. However, Tesco is showing much better prospects for lenders as compared to Somerfield, revealing that its current assets are less than the current liabilities.
Acid Test (Or Quick) Ratio
The quick ratio is used to compare the company’s highly liquid current assets (leaving aside stock) with current liabilities. Here again, the analysis doesn’t reveal a favourable situation. The quick ratio of both the companies, Tesco and Somerfield, don’t provide a considerable assurance that they will be able to meet their obligations that would be due in future. This difference between current and acid-test ratios show the level of stock, each company holds. As both the companies are from retail industry, they are supposed to keep sufficient amount of stock to meet their requirements.
ANALYSIS FOR LENDERS- LONG TERM
The long-term creditors of a company are much concerned with a company’s ability to meet its interest and dividend regularly. The ratios used below help to analyse and compare the long-term credibility of both the companies, I-e; Tesco and Somerfield.
Debt Ratio
This ratio shows the proportion of total assets that have been financed with external borrowings. Tesco’s 24.43% debt ratio indicates that the company relies more on borrowed money or external funds to finance its assets than Somerfield, which has a debt ratio of 18.38%.
Interest Cover
The long-term creditors are interested in analysing the company’s ability to cover its interest liability from its profits. Tesco Plc shows a much stronger position of meeting its tax liabilities 13 times from the profit, while interest cover ratio for Somerfield is also satisfactory as it has an ability to pay off the interest liability 5 times out of its profits.
Dividend Cover
Shareholders provide the risk capital to the firm, they are the residual risk bearers and will only receive dividends after all other financial obligations (e.g. tax and interest payments) have been satisfied (financial management). Here, the interest cover ratio reveals a better position for Somerfield than Tesco. It shows that Somerfield can pay dividends to the stockholders after accounting for every interest and tax liabilities, while Tesco also shows the ability to pay dividends 2 times after any interest and tax liabilities.
Part C:
TESCO- Factors Affecting Future Performance
An analysis of the company’s annual report shows that Tesco has had an upward growth trend in the recent years. Although it is showing a satisfactory performance, but there are some factors that may affect its performance in the years ahead. Some of them have been discussed below:
Increasing Competition
Competition in Retail industry has been increasing to a great extent in UK, which according to the company’s annual report is the major country of operation and sales for Tesco. The annual report shows that in 2005, the company had sales of £29,511m from UK out of £37,070m from its total group sales. Competition is to increase much further in future, which is likely to affect the company’s performance.
Debts and Borrowings
The company’s annual report shows that it has short and long-term debts of about 117% (see appendix) of its total shareholders’ equity, which increases the amount of interest to be paid by the company. This can affect the future performance of the company by minimizing the company’s earnings, being a risky sign.
SOMERFIELD- Factors Affecting Future Performance
Somerfield is paving its way to success gradually, although its pace is much slower than Tesco Plc. As revealed by the company’s annual report, following is the analysis of some factors that are very likely to affect the company’s future performance:
Negative Working Capital
The company lacks working capital that is needed to pay off its short-term liabilities and expenses, whenever the need arises. Although it is a business where inventory can be turned into cash quickly but the company’s current ratio calculated above shows much less than industry average. According to reuters.com (Retail (Grocery) Industry, accessed 03.11.05) the retail industry average for current ratio is 1.19, but Somerfield has a current ratio of 0.75. It can affect its performance, as every company must have enough current assets to meet its short-term liabilities.
Debts and Borrowings:
An analysis of annual report shows that the company’s debts (short term and long term) have increased considerably from the last year. The company’s total debt is about 130% (see appendix) of total shareholder’s equity. This can affect its performance in future, as this factor also increases the interest payable on borrowed loans and thus minimize earnings. The report has also shown an increasing number of borrowings by the company.
CONCLUSION:
After analysing both the companies’ annual reports and financial ratios, a comparison between the two companies has been drawn. Now, we can conclude that among both the companies, Tesco Plc has more concrete and consistent position in terms of profitability, investment and solvency, which not only reveals management effectiveness but also the investors’ trust in the company’s performance. Therefore, Tesco Plc is rightly called one of the giants of retail business.
References
Annual reports, accessed October 20, 2005 from the World Wide Web:
Meigs & Meigs (1993), “Accounting: The Basis For Business Decision Making”, Mc Graw Hill: New York, p934
Mcmenamin Jim (1999), “Financial Management: An Introduction”, Routledge, London
Retail (Grocery) Industry, accessed November 3, 2005 from the World Wide Web:
Somerfield Plc Annual Report and Accounts 2004/05, accessed October 20, 2005 from the World Wide Web:
Somerfield portfolio, accessed October 24, 2005 from the World Wide Web:
Tesco at a glance, accessed October 24, 2005 from the World Wide Web:
Tesco Plc, accessed October 24, 2005 from the World Wide Web:
APPENDIX
Tesco Somerfield
£m £m
Return on Investment (ROI)
Profit before interest and tax (PBIT)__ x 100 = 2,143 x100 66.4__ x 100
Investment (Total Assets- Current Liabilities) 14,338 1,123.1
= 14.95% 5.91%
Gross Profit Ratio
Gross Profit x 100 = 2,703 x100 170.6_ x 100
Sales (Turnover) 37,001 5,174.1
= 7.3% 3.29%
Net Profit Ratio
Profit before interest and tax (PBIT) x 100 = 2,143 x100 66.4__ x 100
Sales 37,001 5,174.1
= 5.7% 1.28%
Stock Turnover
Average Stocks = 1,254_ 304.15
(Total Sales/365) 101.37 14.17
= 12.37 days 21.46 days
Current Ratio
Current Assets___ = 3,457 574.7
Current Liabilities 2,615 770.5
= 1.32 0.75
Acid Test (Or Quick) Ratio
Current Assets- Stock = 2,148 258_
Current Liabilities 2,615 770.5
= 0.82 0.34
Debt Ratio
Total Debt Finance_________ x 100 = 4,988__x100 348.1 x100
Total Assets (Fixed + Current) 20,410 1,893.6
= 24.43% 18.38%
Interest Cover
Profit Before Interest and Tax (PBIT) = 2,143 66.4
Total Interest Payable 170 12.7
= 12.61 5.22
Debt to Equity
Total Debt ___ x100 = 10,603 x100 1,000.2
Total Shareholders’ equity 9,057 766.3
= 117.06% 130.52%