available at £20; this is to a consumer’s advantage because it allows the buyer one third of most railcards and it is useful, depending on the number of journeys made that is. For example, a customer may only make several journeys a year but their marginal utility can decrease per journey.
Below, a table can be seen which measures the level of satisfaction derived from travelling by rail and by coach.
The above table shows that as the number of journeys made in one year increases, the total utility gained from travelling also rises (by rail, it rises by 10), however, by the time the second trip is made, it yields the marginal utility of 12 (32-30) which is the maximum utility obtained and after that, the utility decreases from 4 to 2 to 1 which goes to show that as the number of trips rises, the marginal utility decreases. So, the difference is that the rate at which the total utility is rising keeps falling.
The young persons’ marginal utility level decreasing could be due to many reasons (known to him or her). For this reason, it could be debated that railcards may not be worth purchasing (even if it is at a discount) if a consumers’ level of satisfaction, hypothetically, decreases as each journey is made.
In relation to indifference curve, at a lower indifference curve, a young person is less satisfied than at a higher indifference curve. In this case, this may be due to the fact that rail fare prices have increased. This can be juxtaposed with budget constraint.
Budget constraint is a set of baskets that a consumer can purchase with a limited amount of monetary income (Abwod, 1998) according to Besanko, et al. (2005) given the price of the two different products. The model assumes that total income will be assigned to two products over a given time. When analysing consumer behaviour, a budget line is important because it shows the combination of two goods which can be purchased at a given price.
When the price of rail fares rise affects a young persons budget constraint. The two main constraints on the consumer having maximum utility are income and price. If a young person is on a low income, they may not be able to afford rail fare at an increased price. This is “embodied in the individuals feasible consumption set (the set of all consumption bundles that can be afforded at the current prices with the consumer’s income) and budget constraint” according to Himmelweit, et al. (2002) so this may impact their decision to travel on rail. However, with a £20 rail card, this often helps in their decision to travel with rail; although their budget line and indifference curve is lower, their purchase of rail card would enable them to still travel even if their fares increase, because instinctively, they know that their card gives them a discount.
Due to the rise in rail fare prices, this can decrease the number of times a young person travels by rail. This can cause them to switch to a substitute of rail, thus as the price of rail fare rises, the young person may now decide to travel by coach. This means that their consumption of rail is reduced. This is known as substitution effect because the young person is using another alternative to rail which proves to be cheaper. In addition, with an increase in price, this may mean that a young person may decide not to travel as much as they would want due to their budget constraint so there is a shift to a lower indifference curve and a change in consumption. This is known as income effect (Himmelweit, et al., 2002).
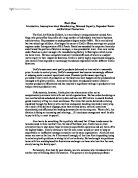
On the next page is a diagram to show the substitution and income effect of a rise in rail fare price.
(Himmelweit, et al., 2002)
When the price of rail fare increases, the budget line shifts from FJ to FD. A young persons automatic instincts us to decrease his or her usage of rail (shift from A to B’).
The substitution effect is a move from B to B’ because the price was increased which decreases rail usage and increases the use of the component good. As the price of rail fare rises, the young person moves from line RU to FD, replacing it with the component good. The young person is still at the same indifference but uses the component good i.e. coach, more than rail.
As for income, when the price increases, there is a movement from A to B, so rail is used less often (Himmelweit, et al., 2002). An increase in the price of rail fare decreases the real income of the consumer so therefore, they travel less, theoretically speaking. The decrease in income does not affect the slope of the budget constraint because it depends on the price so FJ and RU are parallel. The effect of a decrease in income shifts the budget constraint to the left from FJ to RU.
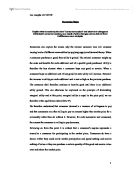
In addition to this, the effect of an increase in price on the budget line can be seen in relation to changes in the indifference curve:
(Himmelweit, et al., 2002)
If the price of railcards were to rise, this would have an effect on the budget constraint of the young person. The slope of the budget line would change and will shift downwards (to the left) and a lower indifference curve will be obtained. If the purchase of railcard were to increase from £20 to £30 or if rail fare were to increase from £2 to £3, the budget line turns inwards so a person’s purchasing power may diminish (Pindyck, et al., 2005). It should be taken into account that the position of the budget line is determined by a consumer’s income and the price of the rail fare (Frank, 2006). So as can be seen above, an increase in the price level causes the budget constraint to decrease.
At the price level of P2 , utility is maximised by the young person at point B and they at a higher indifference curve that they can get to given their budget constraint. Seeing as indifference curve is bowed to the origin, the greatest utility on a budget constraint is in the middle where the budget constraint touches the highest indifference curve, thus they have the same slope. An increase in the price of rail fares (from P1 to P2) shifts the budget line to the left as can be seen in the diagram. The number of times a person travels decreases as the price increases, thus the young person goes down to a lower indifference curve (point A). The young person maximises their utility at B, subject to their budget constraint (ZT), an increase in rail fare (from G2 to G1) causes the budget line to pivot to the left to ZS so the amount of time a person travels decreases theoretically. ZS becomes the new budget constraint (Himmelweit, et al., 2002)
In conclusion, the purchase of a young person’s railcard at a discount (1/3 off) is considered to be worth it- especially for those who make frequent journeys. However, the case of unhappiness may arise as the more a person travels, the less satisfaction they may get- hence, their marginal utility may start to decrease. In concurrence to this, as the price of rail fare increases, this can affect a persons budget constraint, (shifting the budget line to the left) and at the same time, their happiness (lower indifference curve). This causes substitution and income effect. Nevertheless, with all these reasons, purchasing a £20 railcard proves to be ideal and cheaper for a young person in the long run.
Reference
Abwod, J.M. (1998). Consumer Demand Theory. Available from: [Accessed 29th November]
Besanko, D. and Braeutigam, R. (2005). Microeconomics. United States: John Wiley and Sons, Inc.
Frank, R.H. (2006). Microeconomics and Behaviour. 6th ed. New York: McGraw-Hill Companies, Inc.,
Himmelweit, S. et al (2002). Microeconomics. Neoclassical and Institutionalist Perspectives on Economic Behaviour. Bath: Thomson Learning.
Pindyck, R. and Rubinfeld, D. (2005). Microeconomics. 6th ed. New Jersey: Pearson Education Inc.,