We use the complete Keynesian model (AD-AS model) to explain how monetization of debt leads to an increase in prices: In the diagram, the economy is initially in equilibrium at E0 with output Y0, interest rate r0 and price P0. Now when the government increases expenditure (financed by printing of new money), IS shifts to IS’ and LM shifts to LM’ (P0). The increase in transactions demand for money due to an increase in Y is offset by a corresponding increase in money supply thereby unaffecting the interest rate i.e. there is no crowding out effect and the AD curve shifts by a greater amount to AD’. The increase in aggregate demand leads to higher output and hence unemployment falls. The falling unemployment causes nominal wages to rise and since firms follow mark up pricing, prices rise to P1. The economy’s equilibrium moves to E1. Now, since actual price is greater than expected price, workers adjust their expectations upwards thereby shifting AS to AS’. The economy ultimately achieves equilibrium at E2 where output remains unchanged at Y0 but prices rise to P2 (substantially higher than the initial price P1). If monetisation of debt continues then the process keeps repeating and we have hyperinflation.
1.2 The Real Plan and the East Asian Currency Crisis: 1994-1998
In 1994, after years of failed price stabilization plans and resulting high inflation, Brazil initiated a stabilization plan called the Real Plan to correct the large federal deficit by increasing the federal income taxes. Monetary policy also became restrained. Finally, Brazil introduced a new currency called the Real, which was pegged to the dollar on a 1:1 parity basis. The pegged exchange rate sent an important message to the world: Brazil was making a persistent effort to control inflation and was achieving its goal. In 1994, the year the Real Plan began, Brazil’s annual inflation rate exceeded 1000 percent. However, by the end of 1995, price movements were negative.
The Real Plan brought stability and Brazil started attracting capital from abroad. Many multinationals started investing in Brazil because of the new confidence and the future market potential.
The initial success of the Real plan faced many challenges. The Mexican crisis in December 1994 negatively affected Latin America. Brazil suffered as international investors withdrew their short-term investments from the country. The capital outflow put tremendous pressure on the exchange rate, which forced the Central bank to devalue the Real. The second challenge came in the form of the 1997 East Asian currency crisis and the 1998 Russian crisis. Fearing devaluation because of unsustainable fiscal deficits, foreign investors started pulling out their funds from East Asian countries and Russia. The contagion then spread to Brazil. To prevent the capital outflow, Brazil’s central bank sharply increased the interest rates. However, this was not enough to keep foreign currency in the country and consequently Brazil had to devote much of its foreign currency reserves to defend the Real.
The large loss in foreign exchange reserves forced the Central Bank to devalue the currency and in January 1999, the Central bank announced that the Real would no longer be pegged to the dollar. After drafting a fiscal adjustment program and pledging to take structural reforms, Brazil received a $41.5 billion loan from the IMF in early 1999.
SECTION 2
CURRENT MACROECONOMIC ENVIRONMENT:
Brazil under the Lula Government (2003-2010)
President Luiz Inacio Lula Da Silva who first came to power in January 2003 has been one of the most popular leaders Brazil has ever had in recent history. He has been credited with steering the economy towards accelerated growth and bringing about macroeconomic stability. In this section, we analyse the policies of the Lula government and the impact that it has had on the Brazilian economy.
2.1 Lula’s first administrative term (2003-2006)
After years of fiscal mismanagement, stagnation, hyperinflation, and political instability, the Lula government opted for a neoliberal program to ensure macroeconomic stability. Its policies were based on the following three pillars:
- Inflation rate targeting
- Reducing fiscal deficits
- Maintaining a floating exchange rate
Inflation rate targeting:
With inflation rate targeting, the Central Bank estimates and makes public a projected or target inflation rate and attempts to steer actual inflation towards the target by controlling the interest rates. Throughout 2003 to 2006, Brazil’s Central Bank pursued a tight monetary policy to maintain single digit inflation which was a difficult task given Brazil’s hyperinflation legacy.
Using the extended IS-LM framework, we can show how a tight monetary policy helps in reducing inflation: In the diagram, the economy is initially in equilibrium at E0 with output equal to Y0, price P0 and rate of interest r0. Now if Central bank reduces the money supply, the LM curve shifts to LM’ (P0). This leads to excess demand for money, and hence excess supply of bonds. Thus, bond prices fall and rate of interest rises, leading to crowding out effect. Therefore, the aggregate demand curve shifts to AD’. The fall in demand causes firm to produce less output and thus unemployment rises. This causes wages to fall. Now since firms follow mark up pricing, a fall in wages causes price to fall. Thus, a contractionary monetary policy helps in reducing inflation.
Trend in Inflation Rates for the period 2002-2006:
(Source: www.focuseconomic.com)
Although monetary policy was successful in meeting its objectives, it involved the setting of base interest rates that were exceptionally high by international standards.
The graph below shows the trend in the base interest rates (SELIC) set by the Central bank during the period 2002-2006:
(Source: www.focuseconomics.com)
From the borrower’s point of view, the actual cost of accessing funds was substantially higher than that suggested by the base rate. For example, in October 2003, when SELIC stood at 20%, the average annual interest rate paid by consumers was no less than 70%. The reason for the large interest rate spreads was the legal difficulties faced by lenders in enforcing their rights over borrowers in default.
In early 2003, the new government was initially obliged to maintain base rates above 15%. Consequently, GDP rose by only half a percentage point in 2003, the worst growth performance since 1992. With its orthodox credentials established, the government then lowered interest rates by around four percentage points, leading to growth acceleration in 2004. Unfortunately, due to the emergence of price pressures, monetary policy had to be retightened and thus the economic activity slowed notably in 2005.
Thus, the biggest drawback of tight monetary policy was that high interest rates resulted in low private investment leading to decline in productive capacity in several sectors.
Fiscal austerity:
The government was committed to the pursuit of tough fiscal targets as mandated by the IMF. In 2003, the primary surplus target was raised from 3.75% to 4.25% and finally to 5.16% of GDP in 2005. The strengthening of the public finances was because of two factors. First, the government rigorously contained non-debt related expenditures especially in the field of public investment. Second, it resisted the temptation to stimulate activity through tax cuts.
Trend in fiscal deficits for the period 2002-2006:
(Source: www.focuseconomics.com)
Exchange Rate:
The performance of the external account was one the most notable developments in this period. The trade balance showed a surplus because of acceleration in demand for Brazil’s natural based products especially staples like metallic ores, soya and steel. The high interest rates also resulted in huge capital inflow, thus appreciating the Real. Because of the current and capital account surplus, Brazil was able to accumulate foreign exchange reserves, which it had run down during the 1997-1998 crises.
Trend in exchange rate during the period 2002-2006:
Thus, even though the government was able to achieve relatively low inflation rates, reduction in fiscal deficits and a strong performance of the external sector; high growth continued to remain elusive due to the orthodox monetary and fiscal policies. Domestic savings and investment continued to be low, unemployment remained high, and the volume of government spending on social reform, poverty alleviation, and education remained below the desired level.
2.2 Lula’s second administrative term (2007-2010):
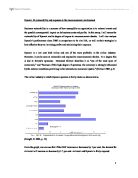
Despite an increase in macro-economic and financial stability in January 2003, faster growth rates remained elusive during the period 2003-2006. GDP growth averaged just 2.6% between 2003 and 2005, well below the regional average (of 4%) for the same period. Compared with other BRIC economies, such as China or India, the rate of GDP growth in Brazil was more disappointing as shown in the table below:
Therefore, the main challenge for the Lula government in its second term was to accelerate GDP growth. In August 2007, the government announced the GROWTH ACCELERATION PROGRAM (PAC) based on five pillars:
- investment in infrastructure
- credit and financing promotion
- enhancing the investment climate
- tax exemptions and improvement of the tax system
- long-term fiscal measures
The program aimed at:
- Tax credits to private sector enterprises for investing in the national infrastructure, a valuable benefit in a country with a notoriously burdensome tax code.
- Tax cuts to stimulate the growth and formalization of micro and small enterprises.
- Personal income tax cut.
- Reducing SELIC
- Increasing long-term finance to investments in infrastructure, especially to water, sanitation and urban development.
- Implementing Brazilian Public System of Digital Registration to reduce bureaucracy and increase efficiency.
The first phase focused on energy and urban planning and the government pledged $526 billion in infrastructure, including opportunities for more than $220 billion in foreign investment.
In 2007, growth jumped to over 5% driven by a small increase in domestic demand. Private consumption grew by 6% due to an increase in employment and real wages. Private investment went up 13 % because of vigorous expansion of consumer credit. However, net external demand contributed negatively to growth. Although exports expanded 17%, imports grew by 32% reflecting the vigor of domestic demand. Thus, trade surplus fell to US$ 40 billion (from US$ 46 billion in 2006), but still a comfortable situation. Monetary policy was partially responsible for the demand expansion as the Central Bank interest rate was driven to the lowest level in recent history (11.3%). Although still high by International Standards, real rates of one digit prevailing since 2006, stimulated borrowing by consumers and explained the boom in the durable goods and housing sector. However, in the final months of the year, further cuts in interest rate were not possible as inflation hit the government target for the year (4.5% up from 3.1% in 2006). FDI reached an all time high of US$ 36 million and the exchange rate appreciated by 18% due to the huge capital inflow.
Continuing its strong economic growth, Brazil became a net external creditor in 2008. Its total external debt fell below its foreign reserves holdings and it was awarded investment grade status by two rating agencies (Standard & Poor and Fitch). Brazil also posted its widest current account deficit in almost six years as faster economic growth spurred imports and remittances of profit abroad.
Financial Crisis 2009
After a growth rate of 5.1% in 2008, the Brazil economy entered into a recession in the first three quarters of 2009 due to the global meltdown. Numerous steps were taken to minimize the impact of the crisis, including injecting more than U.S. $100 billion of additional liquidity into the local economy and reducing Central Bank interest rates. The Brazilian Central Bank slashed 500 basis points off the SELIC, starting in January 2009. The monetary easing left the reference rate at its lowest-ever level of 8.75%.
The Treasury also reacted by speeding up revenue expenditure by increasing (1) public sector payroll; and (2) social security spending and transfers to the private sector. The total payroll of the public sector for 2009 was up by more than R$17 billion, which represents nearly 40% of the estimated growth for total personal income in Brazil. At the same time, taxes were lowered for a series of products, especially taxes on cars. Based on the tax stimulus, the banks, particularly those in the private sector, began to grant consumer loans again, which laid the foundations for a sharp upturn in consumer durables. Thus the economy came out of the recession and posted a positive growth rate in the last quarter of 2009.
The diagram below shows how an expansionary fiscal policy leads to an increase in output using the Simple Keynesian Model:
While the government implemented counter cyclical fiscal policies throughout 2009, the cost of these policies was not very large. They cost the government an equivalent of 1-1.5% of the GDP as opposed to 13% for China and 6.7 % for US.
Despite the end to many stimulus packages and an increase in interest rate by the central bank to 10.75%, real GDP expanded 8.8% y/y in Q2 2010, driven predominantly by domestic demand and investment. The high growth was achieved despite low export earnings because of the global slowdown, which clearly indicates that the economy is less vulnerable to external shocks. The IMF has forecasted a growth rate of 7.7% for the year 2010.
SECTION 3
Challenges and Policy Recommendations
The Brazilian economy has been growing robustly having registered growth rates of 5.7% in 2007 and 5.8% in 2008. It is poised for even more growth: domestic demand continues to recover, exports to Asia (particularly China) are robust, FDI inflows are strong, and Brazilian companies are expanding both domestically and abroad. Moreover, the discovery of new oil reserves will transform Brazil into a major oil exporter by the end of the next decade. The growth forecast for 2010 is 7.7% and for 2011 it is 7%. Given these impressive economic advances, the big question that arises is whether Brazil can sustain such high growths.
In view of this, two major challenges faced by the economy are:
- Chronic lack of infrastructure
Infrastructural facilities like roads, railways, waterways, airports, etc are extremely deficient in Brazil. On an average, the cost of transportation is US$ 28 per ton in Brazil, US$ 14 per ton in Argentina and US$ 15 per ton in the USA. These differences act as bottlenecks and erode the international competitiveness of Brazilian producers. Mineral deposits lie untouched for lack of rail lines while investors drawn to the country's sophisticated financial markets struggle to travel between major cities because congestion leaves airports in chaos.
Due to the tight monetary policy followed by the central bank, interest rates are extremely high which has resulted in low levels of domestic investment. While large Brazilian firms have access to foreign capital, the SMEs cannot evade this scarcity of capital and have nowhere else to turn for loans. According to a World Bank Survey, 90% of Brazilian small firms named high interest rates as one of their major problems.
Therefore, in order to sustain the high growths and to emerge as a superpower the following structural reforms need to be carried out on a priority basis:
- The government should take steps to remove the infrastructural barriers. In August 2010, the government launched the second phase of its Growth Acceleration Program (PAC). PAC 2 is a four-year US$ 526 billion strategic investment program led by the federal government that combines management initiatives and public works projects. These projects will focus on building Brazil’s national infrastructure, with emphasis on improving public transit, drainage, energy, transportation, logistics, roads and civil construction. The projects will offer a total of US$ 498 million in investment opportunities, awarded via five-year contracts.
- The Central bank must take steps to reduce the interest rates and interest rate spreads so that funds are readily available to low income individuals.
- Brazil has the highest tax burden among the BRIC nations roughly amounting to 34% of the GDP. Moreover, the tax rates are cumulative and there are multiple tax agencies, tax rates and bases for calculation. The high cost of complying with tax obligations is an incentive to fraud and tax evasion, whilst tax complexities hamper investment. Tax policies are one of the major reasons why many companies run their activities as informal business. According to a World Bank report, approximately 40% of business in Brazil is informal. Thus, a major reform of tax policies is needed for long-term sustainable growth.
- Quality of education is still poor. Even though the country now has a national educational assessment, the government does not seem to have a clear action plan to improve education. The quality of education has to increase to improve effectiveness and efficiency of the workforce.
- In Brazil the freedom to start, operate, and close a business is limited by national regulatory environment. To start a business in Brazil it takes three times the world’s average of 43 days and more than 234 days to obtain a business license. Sweeping reforms are therefore required to improve the long, complicated, and costly processes of contract enforcement and business registration. Brazil does not provide an environment for entrepreneurs to easily open and sustain business, leading to a big opportunity cost for economic growth.
Conclusion
The neoliberal policies of the Lula government have provided macroeconomic stability to the economy. The selection of Brazil to host the 2016 Summer Olympics is proof positive that Brazil has “made it”. However, there are many structural reforms, such as those mentioned above, that need to be carried out, if Brazil wants to sustain its growth. What now remains to be seen is how the newly elected administration set to take office in January 2011 will address these issues.
REFERENCES
Books:
-
“Macroeconomic crises, policies, and growth in Brazil, 1964-90”, Donald V. Coes
-
“The Brazilian Economy: Growth and Development”, Werner Baer.
White Papers:
- The Brazilian Economy in 2007: Ministry of finance
- Overview of Brazil’s Economy: 2008 IIF Meeting
Research Papers:
-
“Brazil’s Economy Under Lula”, Edmund Amann
-
“Neoliberal Economic Policies in Brazil (1994–2005): Cardoso, Lula and the Need for a Democratic Alternative”
Web References:
- http://www.economist.com
- http://www.focuseconomics.com
- https://www.wikipedia.com
- http://www.roubini.com
APPENDIX
Gross Macroeconomic Statistics of Brazil
Net Public Debt as a percentage of GDP
External Debt as a percentage of GDP