- At this stage we suppose that price of ice cream is 90 pence a scoop and we are required to describe the situation in the crisps market and explain how the price of crisps adjusts.
When the price of ice cream is 90 pence per scoop, it is sold 140 millions of scoops, whereas sellers would like to sell 180 millions, therefore there is a surplus of 40 million of scoops, which means that supply of goods is higher than its demand for 40 million units. To adjust distinction between demand of goods and its supply, and reach equilibrium point between them, needed to reduce the price of ice cream to 70 pence per scoop in this case supply and demand of ice cream will be equal.
- Next we suppose that demand for ice cream increased by 20 million scoops per week.
- Has there been a shift of or a movement along the supply curve of ice creams?
There has been a movement along the supply curve of ice creams to the right.
- Has there been a shift of or a movement along the demand curve of ice creams?
There has been a shift of demand curve of ice creams to the right.
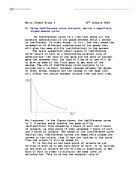
- Use the graph you drawn in a) above to illustrate the change in the market.
- What are the new equilibrium price and quantity of ice creams?
The new equilibrium price is 80 pence per scoop and new equilibrium quantity is 170 millions of scoops of ice cream.
- Now we suppose that new the supply of ice cream increases by 40 million scoops a week.
- Has there been a shift of or a movement along the supply curve of ice creams?
There has been a shift of the supply curve of ice cream to the right.
- Has there been a shift of or a movement along the demand curve of ice creams?
There has been a movement along the demand curve of ice cream to the right.
- Use the graph you have drawn in a) above to illustrate the change in the market.
- What are the new equilibrium price and quantity of ice creams?
The new equilibrium price is 50 pence per scoop and new equilibrium quantity is 180 millions of scoops of ice cream.
Coursework Portfolio Problem 2 Taxing Cigarettes
In this portfolio problem we are asked, using an elastic concept, to explain several scenarios which arose in the cigarettes market after specific tax imposition.
- The price of a pack paid by consumers rises to £6 per litre.
(i) With introduction of the specific tax the supply curve shifts upwards by the amount of tax causing a movement along the demand curve to a new equilibrium point. At this point firms will receive a new price which will make possible to completely recover the tax they have to pay.
(ii) In the first scenario we have price of petrol raised by £2, which is the same amount as imposed tax. If producers were able to increase their prices so dramatically it means that the demand in this particular case is totally inelastic, which means that quantity demanded in the market does not change with a change in price. It is obvious that here consumers bear entire burden of the tax.
(iii)
- The price paid by consumers remains at £4 per pack after the tax is imposed.
(i)
(ii) In the second scenario price of cigarettes remained the same as before tax. If producers were not able to increase their prices not in the least it means that the demand curve in this case is totally elastic, which means that an increase in price by any amount would cause quantity demanded to become zero, however at that price or bellow, producers can sell as much as they produce. It is obvious that here producers bear entire burden of the tax.
(iii)
- The price paid by consumers rises to £5.30.
(i)
(ii) In the third scenario we have price of cigarettes raised by £1.30, which is 65% of imposed tax. If producers were able to increase their prices by such sufficient part of a specific tax, this means that demand in this particular case is relatively inelastic, which means that a change in price leads to a proportionally smaller change in quantity demanded. Consequently consumers bear 65% and producers bear 35% of the incidence of the tax.
(iii)
- The price paid by consumers rises to £4.25.
(i)
(ii) In the last scenario we have price of cigarettes improved by £0.25, which is only 12.5% of the imposed specific tax. In this case producers increased their prices by a small fraction only; this means that the demand curve is relatively elastic and any change in price would lead to a proportionally larger change in quantity demanded. Consumers bear 12.5% of the burden of the tax; producers bear 87.5% of the incidence of the tax.
(iii)