Figure 3
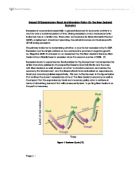
In addition, unemployment rate have gradually decreased to 4.9% (Australian Bureau of Statistics, 2011) as shown in Figure 5 and participation rate increased 0.1 pts to 65.8% (Australian Bureau of Statistics, 2011) this indicates the increased level of economic activity in the economy as well as increased income for individuals. This reduction in unemployment rate is mainly associated with the increase in GDP and can be explained by Okun’s law which is a relation between unemployment and GDP, whereby a 1.5% increase in GDP leads to a 1% reduction in unemployment.
Figure 5
Source: ABS
Investment
Business conditions have remained quite stable, optimistic future outlook for some industries such as the resources sector while gloomy for other industries such as tourism. Investment in mining sector is expected to increase due to high level of commodity prices and strong growth in China and other trading partners in Asia as illustrated in Figure 6 (Statement on Monetary Policy, Feb 2011). An optimistic outlook for China and other trading partners in Asia suggest that strong demand for a number of Australian commodities will continue to support a high level of engineering investment activities in the short to medium run (Statement of Monetary Policy, Feb 2011). However, certain industries such as tourism, manufacturing, export industries have been severely affected by the strong Australian dollar while cautious consumer behaviour is affecting retail industry.
Figure 6
Government Spending
During the GFC the government has increased its spending significantly which had an enormous contribution to the GDP level in Australia. However, government spending has reduced as the economy is moving into the recovery phase. It is predicted that growth in public and public investments will slow down in the near future as the stimulus-related package are completed (Statement of Monetary Policy, November 2010). This can be represented in the following equation:
General equation: GDP = C + I + G + (X- M)
During GFC (08-09): GDP = C↓+ I↓+ G↑+ (X↓- M↓)
Currently: GDP = C↑+ I↑+ G↓+ (X↑- M↑)
As consumption and investment was low during the GFC, the government increased its spending to keep the economy running. The stimulus package as part of the Fiscal policy implemented by the government had been effective, as consumer spending and business investment have increased. Therefore, the government must lower its spending to counterbalance the effect of high consumption and investment.
Net Exports
Due to high commodity prices, Australian exports have performed well providing a significant improvement to export revenue. Strong growth in the value of iron ore exports and coal exports has been the dominant contributor to the high export values in 2010. In addition, high global prices and strong growth in cereal exports has also increased rural exports revenue. The increase in the term of trade coupled with the large interest rate differential between Australia and most other wealthy economies has caused the Australian dollar to appreciate robustly illustrated in Figure 7. The strong Australian dollar has caused some industries to experience difficulties. Services exports are estimated to have declined in the December quarter partly due to the strong Australian dollar which has a negative impact on tourist arrivals while increasing oversea departures. (Statement on Monetary Policy, Feb 2011) However, imports are expected to grow at an above-average pace going forward, reflecting the relatively high exchange rate and expected growth in domestic demand.
Figure 7
Macroeconomic policies used to accommodate GFC
Fiscal Policy
Fiscal Policy is the instrument by which government changes their spending, either in the form of tax collections (t), government expenditure (G) or transfer payments (TR) to ease the fluctuation in the business cycle and helps to maintain stable economy. During the GFC, it is necessary that the government use expansionary fiscal policy to limit the duration of recession and to increase aggregate demand, which is the Keynesian approach.
Discretionary Fiscal Policy
When the GFC has hit the Australian economy, the government applied expansionary fiscal policy by introducing two stimulus packages to reduce recession symptoms. The government firstly introduced the ‘Economic Security Strategy’ to strengthen the Australian economy during the global financial crisis. This strategy will provide a relief from the global crisis through strengthen the national economy and support Australian households.
In order to further increase consumer spending and restore investors’ confidence, the government further introduced a $42 billion National Building and Jobs Plan, providing a boost to the economy of around ½ per cent of GDP in2008‐09 and around ¾ to 1 per cent of GDP in 2009‐10. This stimulus encompasses Government Investment expenditure and Transfer payments to influence the level of aggregate-demand and output, thereby increasing equilibrium income and GDP.
The Stimulus Package focuses on microeconomic reform initiatives and government investment expenditure on large-scale infrastructure projects. $14.7billion was spent on primary and secondary school infrastructure and maintenance, $10.5billion for residential building projects and ceiling insulation for homes, and $890million for road repair and installation of boom gates at rail crossings and regional and local government infrastructure (Budget, 08-09). This direct investment in the nation's infrastructure will bring lasting benefits to the economy as increased activity in the construction sector will increase Aggregate Demand medium term. Moreover, a $2.7 billion spent on business tax break which will assist business by supporting the bring forward and maintenance of their capital expenditure (Budget, 08-09). This is in accordance to the Keynesian model; output (Y) rises proportionately to the change in G as a product of the government expenditure multiplier.
In addition, the Stimulus Package also includes $12.7billion in Transfer payments, a one off tax free cash-handouts of up $950 to income earners, single income two-parent families earning up to $150,000, families with schoolchildren, students and apprentices, and drought affected famers (Gittins 2009). The initiative encouraged individuals to spend money which increases consumption and thus provide an immediate stimulus to the economy. As demonstrated in Equation 1 below, an increase in the Transfer payment will have a direct impact on consumption and hence increases the Aggregate demand or Output in the economy as illustrated in Equation 2.
Equation 1
Equation 2
]
Non-discretionary Fiscal Policy
During the period of recession, high level of unemployment rate causes a reduction in the tax revenue received by the government, that is when Y decreases tY also falls. And since more people are unemployed, welfare payment will be automatically increased for example unemployment benefit will increase (TR increase). As a result, consumption will increase in the medium term and so is output. This is the effect of automatic stabilizer where the government does not take specific actions to smooth out the economic recession in the business cycle.
Monetary Policy
Monetary Policy is the use of cash rate and money supply to achieve its objectives of stable Australian currency, maintaining full employment and the economic prosperity and welfare of the people in Australia (Reserve Bank of Australia). However, the main objective of monetary policy was to maintain target inflation of 2-3% per annum for the medium-term.
During the GFC, the Reserve Bank of Australia used loose monetary policy in an attempt to reestablish consumer and business confidence. This is achieved by lower interest rate on overnight loans in the money market; this low cash rate will influence other interest rates in the economy and therefore alter the behaviour of borrowers and lenders in the financial markets. As shown on Figure 8, the cash rate dropped to only 3% by April 2009 from 7.25% in Aug 2008 (AAP News, 2009). This low interest rate encourages business investment and household consumption and discourages saving which will result in an increase in aggregate demand in the economy.
Figure 8
This can be illustrated using the IS/LM model which shows the relationship between the level of GDP and interest rate shown in Figure 9 below. Loose monetary policy means the RBA increase the money supply in the economy. This will shift the LM curve to the right (LM0→LM1) and leads to a lower interest rate (i1→i*) and thereby generate a higher Y or GDP (Y1→Y*). This is because increased level of money supply will cause deflation and the RBA will reduce the interest rate to encourage consumer spending and business investment.
Figure 9
An End to Extra Government Spending
Since the Australian economy is recovering from Global Financial Crisis, it is reasonable for the government to end the stimulus package. This is because excessive government spending will likely cause inflationary pressure in the economy while creating more budget deficit. This will have a detrimental impact on the economy as RBA will raise the interest rate in order to reduce inflation rate, this however distorts the intention of Fiscal policy.
The government’s stimulus package was targeted at short-term measure to temporarily encourage private sector investment and it has been very effective. As a result of the package, private investment has increased while China’s demand for resources is strong; therefore the government have stopped further funding. The government expect to return the budget to surplus in 2012-2013 and a forecast budget deficit of $40.8 billion in 2010-11 which is $16.3 billion less than expected one year ago (Budget at Glance, 2010-11). A few strategies are being carried out to gradually withdraw the expenditure. This comprise confining annual real growth to 2% until the budget surplus reaches 1% of GDP (Parliament of Australia, 2010) by restricting expenditure, and increasing revenues through Super Profits Tax and higher excise on alcohol and cigarettes (Swan & Rudd, 2010).
Conclusion:
Australia was able to avoid being severely affected by the Global Financial Crisis due to government’s implementation of macroeconomic policies. It is apparent that the economy is recovered from the GFC, this is evident as GDP increased significantly, unemployment declined, government spending reduced, net export and business investment increased. This was as a result of government and RBA’s implementation of expansionary fiscal policy and loose monetary policy. The stimulus package introduced by the government and the reduction in interest rate by the RBA played a major role in restoring consumer and business investor confidence. The stimulus package includes heavy investment in infrastructure which creates more jobs and thus lowers unemployment rate.
However, the government’s high level of spending cannot continue as it will cause inflationary pressure in the economy while further increase government’s budget deficit. This will distort the initial intention of the fiscal policy as RBA will increase interest rate in order to cool inflation down. In addition to the stimulus package implemented by the government, RBA used loose monetary policy to reduce the interest rate in the economy. This has the effect of discouraging household savings while encourage business to borrow and invest which as a consequence increases the aggregate demand in the economy. To conclude, Australian government have been successful in the implementation of these two macroeconomic policies to accommodate GFC as evident by the Australia’s current economic stability.
Reference List:
Dorndusch,R., Bodmam,P., Crosby M., Fischer S. & Startz R. (2006), Macroeconomics, 2nd edition, Sydney: McGraw Hill.
Reserve Bank of Australia, Statement of Monetary Policy, February, 2011 <>
Reserve Bank of Australia, Statement of Monetary Policy, February, 2011
<>
Reserve Bank of Australia, Statement of Monetary Policy, February, 2011
<>
Australian School of Business, April 2010 ‘Winding Back the Stimulus: From here to Austerity <>
Reserve Bank of Australia, “About Monetary Policy”, Reserve Bank of Australia, viewed 19th January, 2011, < >
National Building and Job Plan, Budget 08-09 < >
Budget at a glance 2010-11<>
Swan, W., & Rudd, K. (2010, May 2). Press Release: Stronger, Fairer, Simpler: A Tax Plan for Our Future. Retrieved Sep 4, 2010, from Australian Treasury: <>
Gittins, R. (2009). It may be costly, but it will work. Sydney Morning Herald .
Stevens, G., (2010), “Monetary Policy” Reserve Bank of Australia, February 3, 2009, viewed 17th January, 2011, <http://www.rba.gov.au/media-releases/2009/mr-09-01.html>
Australian Bureau of Statistics, Labour Force, Australia, Mar 2011 <>
AAP News. (2009, September 14). GFC and policy response as unusual as the crisis itself. Retrieved August 27, 2010, from Industry Search News:
Trading Economics, 2011 <>