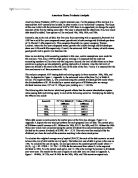
Australian Pharmaceutical Industries LTD (API): The primary activities of the company compromises of a wide range of areas including, retail operation; finance origination and retail services to pharmacists; distribution of pharmaceutical and medical consumable products to hospitals; and manufacture and distribution of pharmaceutical medicines and consumer toiletries. Even though these activities do not directly reflect that of Blackmores, API has fairly stable, long term earnings in the healthcare sector, for comparison.
Sigma Pharmaceutical LTD (SIP): Even though Sigma does not directly deal with vitamins and health supplements the company is similar to BKL as it is concerned with the manufacturing, development and distribution of prescription and generic pharmaceutical products for the Australian and overseas markets. Sigma Pharmaceutical also presents stable earnings and, in comparison to BKL, has similar market capitalization in the healthcare sector.
Capital Structure
Blackmores’ Current & Historical Leverage
In order to show the trend of historical leverage and discuss whether the leverage of BKL is optimal, Debt to Equity (D/E) ratio, Degree of Financial Leverage (DFL), and the Degree of operating leverage (DOL) was calculated and used in the analysis of Blackmores’ capital structure. The financial leverage relates to the interest cost within the long term debt of the organization. Operational Leverage measures relative changes in fixed and variable costs. To furthermore evaluate the characteristics of Blackmores’ leverage, the Total Debt was broken down into, short and long term debt, and then investigated.
The following table summarizes Blackmores’ debt and equity for the past 10 years
Table 1 - Summary of Blackmores' Debt and Equity
Source: Database of Fin Analysis with additional ratio analysis
Debt to Equity Ratio
Following MM Proposition II (with Corporate Tax), VL=VU+TC*B, value of a levered firm increases with debt because of the benefit of the tax shield (Ross, Westerfield and Jaffe, 2009). A positive correlation is expected between the value of BKL and the company’s debt to equity ratio. However, using Earnings per Share as an indicator of value, it was found that the value of Blackmores and the D/E ratio seemed to have no relation as indicated in table 2 below.
Table 2 - Comparison of D/E and EPS
Source: Database of Fin Analysis with additional ratio analysis
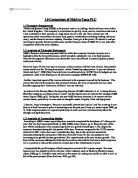
Following this analysis, it is also stated in Modigliani and Miller Propositions and Trade-off Theory, that the profitability of a company can be used to imply the optimum level of leverage. Thus if Blackmores had followed the capital structure of the Trade-off Theory the Return on Assets would be positively related to the D/E Ratio. A correlation of -0.91 between these ratios, indicates that the MM Propositions are not present in Blackmores capital structure. From the Figure 1 below, it can be seen that Total Equity grows at a constant rate throughout the past 10 years and the Total Debt varies significantly in comparison. This can reflect Blackmores’ ability to borrow funds and can be concluded that the company’s level of leverage is dependent on the funds needed for constant growth. This means that the company will not maintain an optimum D/E ratio, as suggested by the Trade-off Theory and profitability, and will hold a low D/E ratio if the funds are not needed.
Figure 1 - Blackmores Debt and Equity ($) (Source: Database of Fin Analysis with additional ratio analysis)
Further breakdown of Blackmores’ debt into long and short term debt also reveals further information regarding the company’s capital structure. The basic trend of Figure 2 below shows an increase of L/T debt and a decrease in S/T debt. It can be seen that Blackmores has an inclination towards the use of L/T debt and reflects minimal short term financial stress on the company.
Figure 2 - Blackmores Long and Short Term Debt ($millions)
Source: Database of Fin Analysis
Degree of Financial Leverage and Operating Leverage
Figure 3 - Blackmores' DFL and DOL
Source: Database of Fin Analysis with additional ratio analysis
The Degree of Financial Leverage was measured through the percentage change in EPS divided by the percentage change in EBIT. The ratio can be used to determine appropriate levels of fixed costs used to finance the firm. From Figure 3 it can be seen that the DFL of Blackmores is fairly stable ranging from a value of 0.21 and 1.59. This is in contrast to the variance of the Total Debt of the company, as noted above, suggesting that the level of debt that Blackmores has used is suitable.
The Degree of Operating Leverage was measured through the percentage change in EBIT divided the percentage change in Sales. The DOL measures the proportion of fixed costs used in comparison to variable costs. The increasing DOL in Figure 3 proposes that Blackmores has been able to adjust its operating leverage to the growth of the company as it is able to maintain steady increasing profits while increasing its fixed costs. The inconsistency in DOL in 2008 to 2010 is consistent with an increase in fixed costs in comparison to variable costs, as a new site for BKL was being developed and opened during that time (BKL annual report, 2008). The impact of the new site is also addressed below in 4.2 Capital Expenditure and Financing.
Capital Expenditure and Financing
Capital expenditure is the investments in long-lived assets for the purpose of maintaining or expanding the company’s operation (Ross, Westerfield and Jaffe, 2009). The funds required for investment can be raised by issuing debt, equity or a combination of both. The capital expenditure of Blackmores is measured through the Net Investing Cash Flow over the past 10 years.
The overall decreasing net investing cash flow in Figure 4 indicates that BKL has been increasing its capital expenditure. This is consistent with the increasing total funds raised over the years. The large anomaly in 2008 can be explained by the breakdown of the net investing cash flow shown in Table 3.
Figure 4 - Net Investing CF (Source: Database of Fin Analysis with additional ratio analysis)
Table 3 – Breakdown of Net Investing CF (Source: Database of Fin Analysis)
It can be seen that in 2008 the cash paid for property plant and equipment is large and in turn affects the net investing cash flow for that year. This large sum of cash is due to the investment in Blackmores new site in Warriewood that was being developed during that year. It is evident that the new site was mostly debt financed as from 2007 to 2008 the D/E ratio increased from 0.35 to 0.75. As suggested previous, it seems that Blackmores D/E ratio is dependent on the funds needed to maintain the growth of the company.
Capital Structure Relative to Competitors
Figure 5 - Debt to Equity Ratio Comparison (Source: Database of Fin Analysis with additional ratio analysis)
The comparative companies that were chosen include, Vita Life Sciences (VSC), Australian Pharmaceuticals (API) and Sigma Pharmaceuticals (SIP). Figure 5 shows the Debt to Equity Ratio comparison between the four companies. In terms of value the three comparative companies are relatively smaller and seem to maintain similar ratios. The capital structure of Blackmores use of debt is apparent in the graph as, during the years 2004 to 2007, the four companies represent alike ratios. The table below summarizes the ROA during 2004 to 2007.
Table 4 - Return on Asset Comparison
Source: Database of Fin Analysis with additional ratio analysis
As stated previous, ROA can be used as an indicator for the optimum leverage in terms of the Trade-off Theory, where a higher profitability suggests a higher D/E ratio. This is evident in SIP where the subsequent drop in ROA from 2004 to 2005 lead to a decrease in the D/E ratio. The table presents BKL’s ROA is much higher, however during this time the D/E ratio is similar between all companies. This can suggest that Blackmore’s has the capability to maintain the higher D/E ratios in the other years.
Bankruptcy Risk Assessment
Two methods were used to evaluate Blackmores bankruptcy risk assessment, being Net Interest Cover and the Quick Ratio. It is evident through various texts that these tests are valid in assessing bankruptcy.
Net interest cover is calculated by dividing EBIT by the interest expense, and reflects how capable a firm is in meeting its financial obligations (Ross, Westerfield and Jaffe, 2009). It is a measure of a firm’s ability to pay interest owing on its debt. Table 5 outlines BKL’s net interest cover over time and comparison between the three firms.
Table 5 - Blackmores' Net Interest Cover and Comparison
Source: Database of Fin Analysis with additional ratio analysis
It can be seen that the EBIT is much greater than the interest expense incurred during that year and therefore Blackmores’ has the substantial ability to pay interest owing on its debt. This is also evident in the comparison to other firms in the same industry. On average Blackmores’ net interest cover is much greater when compared to VSC, API and SIP.
To furthermore analyze BKL’s bankruptcy risk assessment the Quick Ratio is used. The quick ratio measures the liquidity of a company. The quick ratio equals Cash plus Accounts Receivable divided by the firm’s Current Liabilities. Table 6 below shows Blackmores’ Quick Ratio against other firms in the industry.
Table 6 - Blackmores' Quick Ratio and Comparison
Source: Database of Fin Analysis with additional ratio analysis
The quick ratio of BKL has been increasing over time and from 2006 has maintained a ratio greater than 1. The other firms in the industry have represented an overall lower and a more volatile quick ratio. It can be concluded that BKL has improved its liquidity and seems to be financially strong in the short term.
Through the two bankruptcy assessments of Net Interest Cover and the Quick Ratio, it can be expressed that Blackmores has the ability to meet all its obligations of its debt. This supports Blackmores capability to take on additional debt when the funds are required.
Leverage Policy Summary
Through the above analysis there are various characteristics of Blackmores’ leverage policy that is evident. BKL seems to deter in the use of debt when it is not needed to fund their operations and will not maintain an optimum D/E ratio as suggested by Modigliani and Miller Propositions. Blackmores level of leverage is dependent on the funds needed for constant growth after funds are raised through equity, and thus will hold a low D/E ratio if the funds are not needed. This is evident in the D/E ratio and capital expenditure studies above. The new site can be said to be mostly debt financed, representing a high D/E ratio at this time and otherwise the firm maintains a lower ratio. The determent of debt use by BKL can be to minimize the financial stress on the company as it has an inclination towards the use of long term debt. This will allow for high growth in the company.
Blackmores also has the capabilities to obtain debt finance and maintain a higher leverage. This is proven through the comparison between similar companies in the industry and the bankruptcy risk assessments.
Is this the Optimal Leverage Policy?
Optimal Leverage suggested by Corporate Finance texts can be indicated by the profitability and types of assets a firm holds (Ross, Westerfield and Jaffe, 2009). As noted previous, ROA and the leverage of BKL is almost perfectly negatively correlated at -0.91. Furthermore the amount of intangible assets held by BKL is correlated to the D/E ratio, where the optimum level for financial leverage is the opposite.
However the shortcomings of Trade-off Theory and capital structure have been addressed by Ross, Westerfield and Jaffe (2009). It is specifically noted in this text that there a very successful companies with minimal debt and gives an example of pharmaceutical companies, with large intangible assets, that have the ability to borrow large amounts of money without the concern of financial distress.
Blackmores leverage can be said to be not optimal according to the Modigliani and Miller models of capital structure. However it is apparent that there are various companies that do not follow this structure and are still very successful. As Blackmores has consistently increased the value of its company and the financial leverage studies have been positive, it can be concluded that an Optimal Leverage Policy is irrelevant in Blackmores capital structure.
Dividend Policy
Current and Recent History of Dividend Payment
Table 7 - Blackmores' Dividend History and Analysis
Source: Database of Fin Analysis with additional ratio analysis
The dividends per share and earnings per share have a general increasing trend in the past 10 years. It can also be seen that the franking rate is 100% for all years. This is beneficial for the stockholder as Blackmores is passing on the benefit from the dividend imputation tax system to the stockholder. Further analysis of BKL’s dividends leads to the Dividend Payout Ratio. The dividend payout ratio is calculated by dividing the dividend per share by the earnings per share and indicates how well the company’s earnings support the paid dividend (Brealey, Myers, Parlington and Robinson, 2000). The payout ratio of Blackmores is relatively high from 2001 to 2004 and has then stabilized to an average of 78% in the following years. Even though this is the case, Blackmores has still been able to steadily increase dividends.
Dividend policy comparing to comparable firms
In parallel to the capital structure comparison the companies chosen to compare the dividend policy include, Vita Life Sciences (VSC), Australian Pharmaceuticals (API) and Sigma Pharmaceuticals (SIP).
Due to the higher earnings per share of Blackmores the dividend paid is substantially higher in comparison to the other three companies. Thus BKL presents a favorable dividend. In addition, factoring out the higher dividends paid, BKL portrays a constant growth in its dividend payments. The dividends of API and SIP are fairly volatile and also includes some years were there are no payments to stockholders. VSC has just recently been publicly listed and did not exist on the ASX pre 2007. However Vita Life Sciences did present a dividend per share of 0.5 cents in 2010, a dividend payout ratio of 6%.
Figure 6 - Dividends Per Share Comparison
Source: Database of Fin Analysis
Figure 7 - Dividend Payout Ratio Comparison
Source: Database of Fin Analysis with additional ratio analysis
The comparison of Divdend Payout Ratio, between the four companies in the health sector, yields more comparable results. As the ratio represents dividends as a proportion of earnings per share, the companies are more consistent with one another. Even though in some years API and SIP have a larger payout ratio in comparison to BKL, BKL is again very consistent with its dividend policy. It can also be noted that a larger payout ratio does not necessarily correspond to a superior policy, as the ratio measures the ability of the company to support the dividend. This factor could be the reason for the fluctuations in the payout ratio for API and SIP. The large ratio of SIP in 2003 and 2010 (negative payout ratio due to a negative EPS and a dividend payment), could be a result of Dividend Signaling Theory and will be discussed further below. In conclusion, the dividend policy of Blackmores is far superior to the three companies, not only because of the higher dividend payments, but the constant growth rate and the ability of Blackmores to support its dividends.
Relevant Company Characteristics to its Dividend Policy
Blackmores constant earnings growth has allowed the general increase of dividends each year and such a dividend policy promotes higher share prices (Ross, Westerfield and Jaffe, 2009). This concept, known as the Dividend Signaling Theory, allows for BKL’s management to signal to the market that it is confident in the growth of the company. BKL achieves this by consistently increasing the dividend and maintaining payout ratio that represents the company’s ability to afford the payments. In turn share holders will be leaning towards buying stock in BKL and thus increasing the share price. Investors can distinguish between profitable and unprofitable firms through dividends, as it can convey information about the future of the company (Brealey, Myers, Partington and Robinson, 2000). As asymmetry of information exists between the shareholder and management, dividends can be used to portray additional information. Thus Blackmores’ dividend policy portrays management’s plans and confidence in the growth of the company.
Blackmores’ characteristic of growth also contributes to the Dividend Reinvestment Plan that the company has offered, recently in 2006 and 2008 (Annual Report, 2008). This scheme allows for BKL to raise funds through minimizing the dividend payouts. The funds raised will contribute to the further growth of the company
Analysis of Company’s Dividend Policy and Lintner’s Analysis
As shown in the analysis above, Blackmores’ dividend policy has shown an increasing trend in its dividend payments and a level of dividend payout ratio that is constant and does not exceed the capabilities of the company. To further examine BKL’s dividend policy the dividend payout ratio is considered in more depth.
Figure 8 - Blackmores' Dividend Payout Ratio
Source: Database of Fin Analysis with additional ratio analysis
It can be seen from Figure 8 that during 2001 to 2004 the dividend payout ratio fluctuates in contrast to the consistent ratio from 2005 to 2010. The comparative volatility during 2001 and 2004 can be explained by the Dividend Signaling Theory, signifying management’s confidence in the growth of the company. Another approach would be to examine Lintner’s Analysis.
Lintner suggests that dividend changes are due to long-run, sustainable levels of earnings and managers are reluctant to make these changes if there is the possibility that it has to be reversed (Brealey, Myers, Partington and Robinson, 2000). In examining the EPS, constant growth of Blackmores was achieved after 2002 and before this time, EPS had been slightly volatile. Therefore, as dividend changes occur after long-run sustainable levels of earnings, the stability of the payout ratio occurring in 2005 can be explained. The higher payout ratios during 2001 and 2004 can reflect that management of BKL having confidence that there is no possibility that the dividends will be reversed. Lintner’s model also suggests that managers are concerned with dividend stability (Brealey, Myers, Partington and Robinson, 2000) and this is evident in the period after 2004.
Optimal Dividend Policy
Blackmores’ performance in its dividend policy over the past 10 years has been impressive, the only downside being the dividend payout ratios from 2001 to 2004. However between 2001 and 2010, the dividends per share have been consistently growing and after 2004, the dividend payout ratios have been at a consistent level at a rate the company can afford. The policy would be appealing to the public and the policy supports BKL’s plans for development and growth.
In addition the policy also reflects the dividend signalling model as well as Lintner’s analysis. With the continued growth of the company, a stable increasing trend of dividend per share and a stable dividend payout ratio, it can be concluded that the dividend policy is optimal.
Valuation
Valuation of a business is the optimal mechanism for investors to have a comprehensive understanding of a business prior to make any investment decisions, There are 3 methods widely adopted by financial analysts when they evaluate a company, they are adjusted Present Value Approach(APV); Flow to equity Approach (FTE); and Weighted Average Costs of Capital approach(WACC). In this report, we will use the WACC method as a valuating parameter to estimate the value of a firm. This includes beta estimation, weighted average cost of the capital estimation and future cash flow forecast. Also we will estimate Blackmores share price by using the valuation assumptions, and determine how sensitive the value per BKL share is to changes under the movement of the sales growth rate and WACC. Finally, this report will provide the conclusion based on sensitive analysis, regards to the accuracy the BKL’s current market value, and recommend an investment decision regarding the holdings of BKL’s shares.
Assumptions
The following valuation and sensitive analysis is based on the assumptions shown in Table 8 below. All assumptions listed in the Table will be discussed further in detail.
Table 8 - Assumptions of Valuation
Valuation Method
The Weighted Average Cost of Capital method (WACC) is a common technique used to calculate the projects' after tax cash flow assuming all-equity financing(UCF).
The formula of Weighted Average Cost of Capital (WACC) is:
Where:
rS = cost of equity
rb = cost of debt
S = market of the firm's equity
B = market value of the firm's debt
S + B= V( total value of the firm)
S/(S+B) = weight of equity in the firm’s capital structure
B/(S+B) = weight of debt in firm’s capital structure
Tc = corporate tax
Determining the Cost of Equity (rS)
The cost of equity capital (rS) of a firm is the rate of return on investment for the company's ordinary shareholders. It can be calculated by using the Capital Asset Pricing Model (CAPM), in which the cost of equity equals the risk-free rate plus beta times the market premium:
Risk free rate (rf) Assumption No.1
In theory, risk-free rate is the rate of return of an investment with zero risk. rf should be the long term government bond yield when doing longer term projects or valuation. So here we assume that the risk free rate (rf) is the yield on 10 year Australian government bonds, which is 5.56% (RBA 2011).
Market risk premium (MRP) Assumption No.2
It is assume the market risk premium (Rm-Rf) in the calculation is 8%. According to the Bishop and Officer study (2009), the market risk premium in Australia from 2010 to 2014 will be around 7%-12% p.a., thus, conservatively 8% p.a. was chosen, as the appropriate MRP in the calculations.
Equity beta(βe) Assumption No.4
Under the estimation of BKL’s beta, it is assumed that the ordinaries index (AORD) is a proxy to the Australian stock market.
Beta is calculated using regression analysis, and it is the tendency of the security's returns to respond to swings in the market. It measures an individual stock’s risk relative to the overall market risk. The BKL monthly-adjusted close prices in the last 5 years and All Ordinaries monthly-adjusted close prices in the last 5 years were used to calculate the historical returns of both BKL shares Rib and the All Ordinaries index Rmc. Using this information in regression analysis the beta βe. of BKL was calculated.
The formula for historical return (BKL or Market index shares):
The figures can be seen in Exhibit 1 of the Appendix.
Finally, Excel's regression analysis was used to calculate the beta by comparing the BKL monthly historical returns in the last 5 years with market index monthly returns in the same period.
The graph below indicates BKL’s beta, where β of equity is the slope of the line, computed as 0.87.
Figure 9 - Regression Analysis
The following parameters, βe=0.87, MRP=8%, rf =5.56% were then substituted into the CAPM model to calculate the cost of equity:
Determining the Cost of Debt (rb)
Cost of debt is the effective rate that a company pays on its debt. Blackmore 2010 year's financial report shows that BKL only held long term debt, to a sum of 47.36 million, and interest expense payments of 2.44 million to debtors. Therefore, the cost of debt can be calculated by using the formula:
Rb before tax = =2.44/47.36 =5.15%
Weighted Average Cost of Capital (WACC)
Assumption No.3 and 5
To calculate the weighted average costs of capital for BKL, it was assumed that BKL’s debt to equity ratio is 56.12%, which was calculated by using the average of the last 10 years of the debt to equity ratio and this can be seen in Exhibit 2 of the Appendix.
Therefore, based on the Australian corporate tax rate of 30%, the weighted average cost of capital for BKL is:
=
= 9.32%
Estimating the Future Sales Growth Rate
Assumption No.6
The growth rate of , will be assumed to be constant for the next 10 years. Table 9 below shows BKL's growth rate in operating revenue, in the last 10 years and the average was used to forecast the income statement from 2011 to 2020 as shown in Exhibit 3 of the Appendix.
Therefore the sales growth rate for 2011 to 2020 (10 years) is assumed to be at a constant 10.73%.
Estimating Future Cash Flows
Assumption No.7
Based on BKL’s future sales growth rate (10.73%), it was predicted that operating revenue was forecast for 2011 to be 238.96, a 10.73% increase on 2010 financial year's operating revenue data. The forecast for depreciation is based on the average ratio to the sales revenue in the last 10 years shown in Exhibit 3; 4; 5 of the Appendix. Using the formula below the free cash flow for 2011 to 2020 was calculated.
Table 9 - Calculation of Free Cash Flow
Estimating Firm value
To estimate BKL's firm value the net present value of the future cash flows from 2011 to 2020 plus the terminal value of the firm after the year 2020 was used, following the formula below:
To identify the value of Blackmores from 2011 to 2020, the free cash flows, shown in Exhibit 5, will be discounted back at 9.32% (the WACC calculated previous)
PV (2011-2020) = 11.95/1.0932 + 13.24/1.09322 + 14.66/1.09323 + 16.23/1.09324 + 17.97/1.09325 + 19.90/1.09326 + 22.03/1.09327 + 24.40/1.09328 + 27.02/1.09329 + 29.92/1.093210
=115.92million
To find the terminal value representing the cash flows after 2020 for BKL, it was assumed that the firm will grow at a constant rate of 7%. As a growing perpetuity project, the value of Blackmores after 2020 is: PV = Error! Reference source not found.
where C is the cash flow in 2021, r is the discount rate (9.32%), and g is the constant growth rate(7%). Hence, the terminal value as of 2020,
= [29.92*(1+ 7%)]/ (9.32%-7%) = 1379.93 million
The above terminal was then discounted back to obtain the present value of,
= 1379.93/(1. 0932)10 = 556.06 million
Hence the total value of the firm = PV (2011-2020) + PV (terminal value as of 2020)
= 115.92million+ 556.06million
= $681.98million
Since the total value of the firm consists of the firm's debt and equity, the value of debt needed to be subtracted from the value of equity. Where, the value of the debt equals the value of debt in 2010 (annual report, 2010).
Value of Equity = total value of the firm – total value of the Debt
= $ 681.98million - 47.356 million
= $634.62 million
The formula below was used to find the value per share. It was found to be 16,677,000 shares issued in 2010 (Annual Report, 2010), thus:
Value per share = Value of the equity / number of shares
= $634.62million /16,677,000
= $38.05/ share
Sensitivity Analysis
Sensitivity analysis is used to determine how “sensitive” a model is to changes in the value of parameters in the model. As the valuation model presented is sensitive to the the cash flow discount rate and growth rate from operating revenue, these factors were used as a measure of how BKL’s share price responds to changes in these parameters. Therefore the WACC; sales growth rate of between 2011 and 2020; and the sales growth rate after 2020 were used in the sensitivity analysis. The analysis is performed to check how susceptible the company is to the changes in key factors in the future.
Share price sensitivity to changes in the Sales Growth Rate (2011-2020)
Upon changing sales growth rate from the current 10.73%, it was noticed that the share price is positively correlated to growth rate. As the growth rate decreases by 30%, the share price drops by almost 19.58%. However, a share price increases of around 23.26% was achieved when the sales growth rate increased by 30%.
Table 10 - Changes in share prices to Change in Growth rate (2011-2020)
Figure 10 below shows the positive movement of share price related to changes in the sales growth rate between 2011 and 2020
Figure 10 - Percentage Change in Share Price
Share Price Sensitivity to Change in the Sales Growth Rate (after 2020)
Based on the movement of changing our sales growth rate of 7%, it can be seen from the table below that the share price is positively correlated to the sales growth rate excluding the point at which the factor equals 10.50%.
Table 11 - Changes in share prices to Change in Growth rate (after 2020)
Share Price Sensitivity to Changes in WACC
As it can be seen from Table 13, a change in WACC is not consistently related to the change in share price. A -50% change in the WACC results in a -220.66% change in the share price of the company, whereas a positive 50% change in the WACC leads to a -73.38% change in the share price.
Table 12 - Change in Share Price to Change in WACC
The graph below shows the sensitivity of the company share price to changes in the WACC.
Table 13 - Change in Share Price to Change in WACC
Comparison of the Estimated and Actual Share Price
Blackmores’ historical share price on the 2nd May 2011 equals $29.82 per share compared to the estimated share price that was calculated to be $38.05.
The reason for these differences can include:
- Approximate assumptions were made in the estimation of WACC, such as the market premium of 8%, the risk free rate and additionally it is difficult to estimate beta. Varying WACC estimations have been shown to largely affect the share price.
- The growth rate used is 10.73%, and is based on the moving average method to forecast free cash flow. The future growth rate might differ in comparison to this percentage. The affect of differing estimations of the growth rate were shown in the sensitivity analysis.
- Data used is only limited to 10 years. More extensive use of data could give a better result.
- Also the calculation does not include the behavioral theories of corporate finance, including fluctuating movements in the market and irrational behavior.
Investment Recommendation
In conclusion our analysis shows a higher calculated share price of $38.05, compared to the current share price on 2nd May 2011 of $29.83. Our analysis shows that a rational investor would invest in BKL stocks as it is priced below the intrinsic value. Hence, rational investors will prefer to increase their investment in BKL as the current market share price is undervalued. However, as shown in the sensitivity analysis previous, the valuation is based on assumptions and slight errors in these estimates will lead to differing results.
Based on the analysis in the report of, capital structure and leverage; dividend policy; and the valuation of the company, Blackmores presents a strong growth profile and represents a financially healthy firm. Asia still provides vast opportunities for BKL and we believe that the company will continue to grow in the future. In our opinion these factors will continue to increase the share price and thus recommend increasing the holdings of shares in Blackmores LTD.
Appendix
Exhibit.1: 60 months( 5 years) BKL historical share prices and All Ordinaries market index share prices:
Exhibit.2: BKL historical debt to equity ratio from 2001 to 2010(10 years)
Sources: Ratio Analysis, Finanalysis
Exhibit.3: Income statement forecasting (2011-2020)
Exhibit.4: Change in net working capital forecasting (2011-2020)
Exhibit.5: Cash flows forecasting (2011-2020)
Reference
- Australian Stock Exchange, 2011 http://www.asx.com.au/research/dividends/process.htm (Viewed:2011-05-25)
-
Bennet, M., “Analysts take stock of retail’s internet drift”, The Australian, 10 December 2010, p.21
-
Bishop, S. & Officer, B. 2009, Market Risk Premium Estimate, Value Adviser Associates Pty Ltd, Australia, (viewed:2011-05-21)
- Brealey, Myers, Partington & Robinson (2000), Principles of Corporate Finance, Australian edition, McGraw-Hill
-
Blackmores Limited (BKL.AX), Yahoo Finance, (access date: 2011-05-20)
-
Blackmores Homepage, (viewed:2011-05-15)
-
Blackmores Limited, Income Statement, Yahoo Finance , (viewed: 2011-05-25)
-
Blackmores Limited, Balance Sheet, Yahoo Finance, (Viewed: 2011-05-26)
-
Blackmores Limited, Annual Report 2001-2010, UTS Database
-
Reserve Bank of Australia, , (viewed 2011-04-29)
- Ross, Westerfield & Jaffe, Corporate Finance, 9th ed., 2009, McGraw-Hill (RWJ)
- Grinblatt & Titman, Financial Markets and Corporate Strategy, 2nd ed., 2002, Irwin/McGraw Hill (GT)
-
Share Dividends, 2011 (View: 2011-05-19)